709 results
7th grade graphing pdfs $5-10
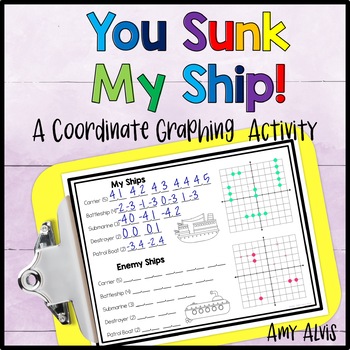
Coordinate Plane Graphing Plotting Points Math Battleship Activity
You Sunk My Ship is a coordinate plane graphing activity, similar to Battleship, where students will battle it out in a head to head competition trying to locate each other's ships. Your students can complete in this engaging and strategic activity while practicing their math skills. Includes file folder game boards for quadrant I practice as well as one that uses all 4 quadrants (4 versions for each one). Also included are one page versions of the activity as well as a quiz.Packet includes:-Te
Subjects:
Grades:
5th - 8th
Types:
Also included in: 6th Grade Coordinate Graphing Bundle Poster INB Game NO PREP Printable
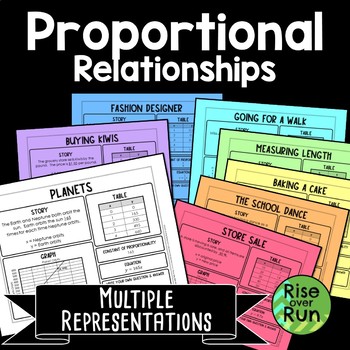
Proportional Relationships Graphing with Multiple Representations
These multiple representation math tasks help students make connections between graphs, tables, equations, and real world scenarios. Students are given a little information and must think how to fill in the rest!8 activity sheets each include: a story a grapha tableconstant of proportionalityan equation a space for students to write their own question and answer. A blank template is included as well so students can create their own proportional relationship.Multiple representations are a great w
Grades:
7th - 8th
Types:
Also included in: 8th Grade Math Activities & Lessons Bundle for the Whole Year
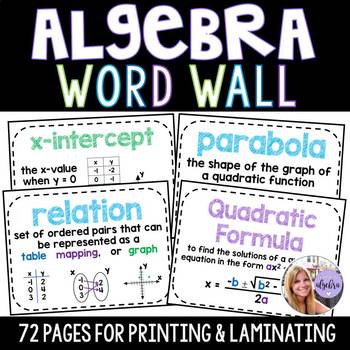
Algebra 1 & Middle School Math Word Wall Posters - Set of 72 Words
This is a set of 72 landscape posters that highlight many of the key vocabulary terms used in Grade 8 Math as well as Algebra 1. This set also comes with a title banner that says "Algebra WORD WALL" :)This word wall can be displayed altogether all year long (which is what I do above my main teaching wall) or the words can be displayed as they are being used throughout the year. This word wall has the following 72 terms:absolute valueadditive identity & inversearithmetic sequenceaxis of symm
Subjects:
Grades:
7th - 10th
Also included in: Math Word Walls - Grade 6, 7, 8, Algebra, and Geometry Bundle
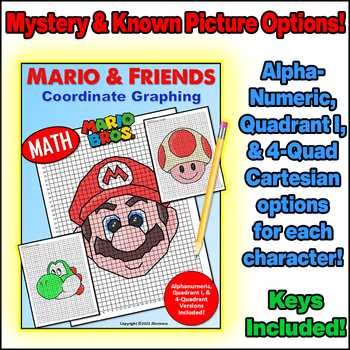
Mario's Nintendo Coordinate Graph Mystery Pictures! March 10 MAR10! Mario Day!
SAVE with the 10 Character Bundle: https://www.teacherspayteachers.com/Product/9249343Alphanumeric, Quadrant I, and Full Cartesian Grid versions of each picture are included!Coordinate Plane Graphing can be fun, and the pictures students graph don’t have to be boring! Each character comes with blank coordinate planes and complete instructions to graph them.All of my coordinate graphs use whole numbers... No fractions or decimals to confuse the graphing!In this set, you will find 3 versions of th
Subjects:
Grades:
3rd - 8th
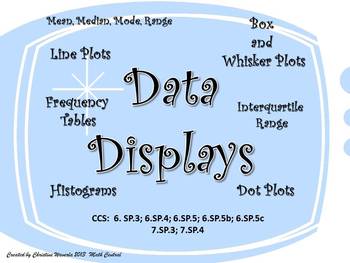
Data Displays: Line Plots, Histograms, Box and Whisker Plots, Frequency Tables
This is one of my favorite teaching tools! I created this Data Display set of worksheets this year for my 6th grade class. My students loved using these worksheets to practice their new skills. Each worksheet provides plenty of room for students to create their data displays and answer questions based on the data. Questions ask students to find the mean, median, mode, range, interquartile range, and percentages.These worksheets are fully aligned with the Common Core Curriculum.CCS: 6.SP.3; 6.SP
Subjects:
Grades:
6th - 8th
Types:
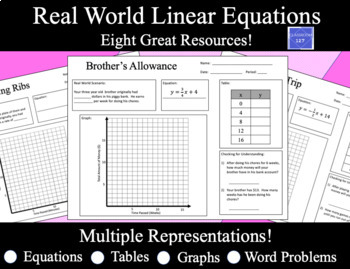
Linear Functions Word Problems: Multiple Representations
This product is GREAT at having students make connections between real world scenarios, tables, equations written in slope intercept form, and linear graphs!This product contains eight different resources about different real world scenarios that have a constant rate of change. Information is presented to students in only one of four ways. The four ways that students can be presented with information about the real world situation includeBy a word problemBy an equation written in slope intercep
Grades:
7th - 10th
Types:
CCSS:
Also included in: Custom Bundle for Chris
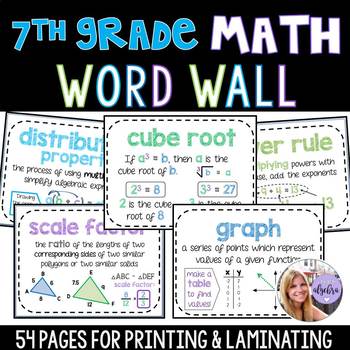
7th Grade - Pre-Algebra Middle School Math Word Wall 54 Posters
This is a set of 54 landscape posters that highlight many of the key vocabulary terms used in Grade 7 Math as well as pre-Algebra 8th Grade. This set also comes with a title banner that says "7th Grade Math WORD WALL" using my math doodle background! :)This word wall can be displayed altogether all year long (which is what I do above my main teaching wall) or the words can be displayed as they are being used throughout the year. This word wall has the following 54 terms:constantdistributive pr
Subjects:
Grades:
7th - 10th
Also included in: Math Word Walls - Grade 6, 7, 8, Algebra, and Geometry Bundle
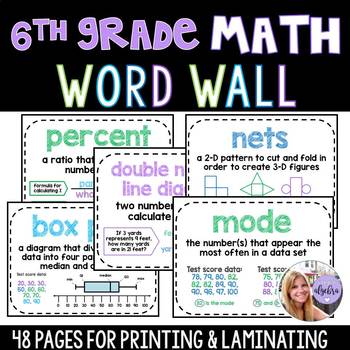
6th Grade - Pre-Algebra / Middle School Math Word Wall
This is a set of 48 landscape posters that highlight many of the key vocabulary terms used in Grade 6 Math. This set also comes with a title banner that says "6th Grade Math WORD WALL" that you can use!This word wall can be displayed altogether all year long (which is what I do above my main teaching wall) or the words can be displayed as they are being used throughout the year. This word wall has the following terms:ratiounit ratetape diagramdouble number line diagrampercentgreatest common fac
Subjects:
Grades:
5th - 9th
Also included in: Math Word Walls - Grade 6, 7, 8, Algebra, and Geometry Bundle
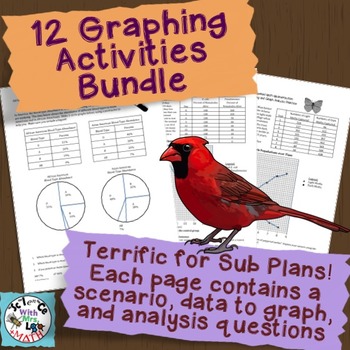
Graphing Practice Bundle: 12 Pages to Graph with Analysis Q's - Great Sub Plans!
Included in this bundle are 12 different graphing pages! Each page gives the students a different scenario, data, and space to graph that data. Each page then includes 1-3 questions that ask the student to analyze the graph. Many provide a possible explanation for the graph’s trend. Included are several scatter plot type graphs, one bar graph, and one circle graph activity. Each page is followed by an answer key!Some of the analysis questions are left purposely a little vague! I like my st
Subjects:
Grades:
7th - 12th
Types:
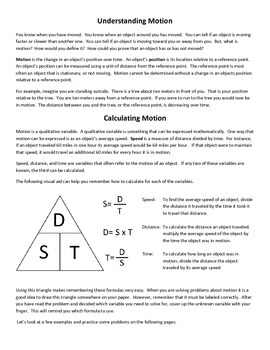
Calculating Speed, Time, Distance, and Graphing Motion - Distance Time Graphs
This activity is centered around the concept of motion. This activity defines motion and gives instruction and examples on how it cat be calculated and graphed. This activity includes informational text on calculating and graphing motion as well as a variety of problems to check for understanding. There are problems that involve solving for speed, distance traveled, and time in motion. Distance vs. Time and Speed vs. Time graphs are discussed. Twelve distance vs. time graphs and twelve spe
Subjects:
Grades:
4th - 9th
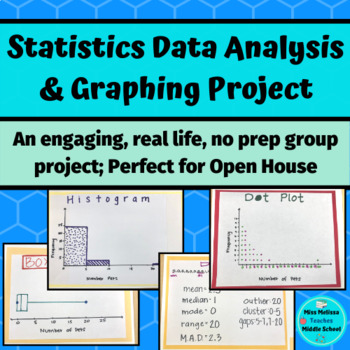
Statistics Project: Data Analysis & Graphing- real life, no prep
This statistics project is intended as a closure for your sixth grade statistics unit and aligns with ALL of the sixth grade statistics and probability common core state standards. In groups, students work together to choose a statistical question to ask the class. Once the class is surveyed, the group works together to create a frequency table, a dot plot, a histogram, and a box and whiskers plot. After creating their graphs, the groups analyze their data by looking at the mean, median, mode ra
Subjects:
Grades:
6th - 7th
Types:
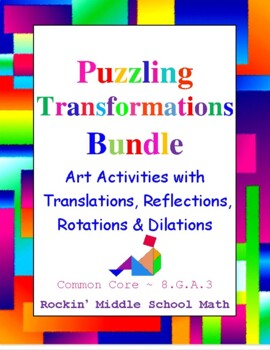
Transformations on the Coordinate Plane Bundle: Puzzle Art - Common Core 8.G.A.3
Transformations have never been so fun with this high interest, interactive, easily differentiated bundle. It contains 7 transformation activities where students must use the given pre-image points, perform the stated transformation(s), and then plot the new image points to create a figure on the coordinate plane which they can color. Each activity covers a different transformation, or a mixture of several transformations on the coordinate plane. You could easily differentiate by student's nee
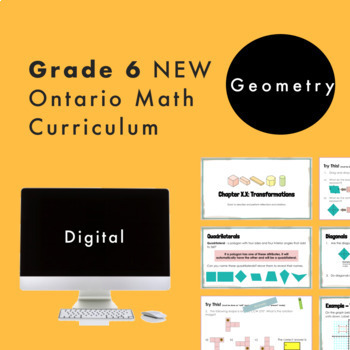
Grade 6 Ontario Math - Geometry Curriculum - Digital Google Slides+Form
Are you planning for the NEW Grade 6 Ontario Math Curriculum? This fully editable Google Slide resource is what you need! *Note that this contains NEW lessons with added expectations from the new curriculum. This resource is for the SPATIAL SENSE strand and covers ALL specific expectations for “E1. Geometric and Spatial Reasoning”. In this resource, students will experience math through engaging real-life questions, storytelling through math, and interactive slides. For teachers who are given N
Grades:
5th - 7th
Types:
Also included in: Grade 6 NEW Ontario Math Curriculum Full Year Digital Slides Bundle
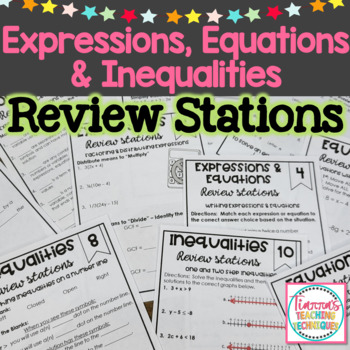
Expressions, Equations and Inequalities Review Stations
A set of 10 Review Stations all about Expressions, Equations and Inequalities! Practice graphing inequalities, solving one, two and multi-step equations, essential vocabulary, checking solutions, using fractional coefficients and the special rule with inequalities. <<<Highly recommend using these for test prep or review to wrap up the unit. Students should feel confident in their abilities and ready for their assessment! >>>I love stations as it promotes independent and grou
Subjects:
Grades:
7th - 8th
Types:
Also included in: Expressions, Equations and Inequalities Center Activities BUNDLE
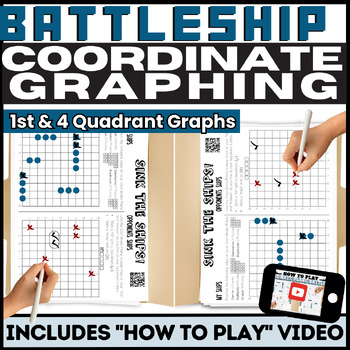
Plotting Points on the Coordinate Plane Graphing Battleship Game, Differentiated
Students will love plotting points on the coordinate plane while playing this Coordinate Plane Graphing Battleship Game! Available in First Quadrant and Four Quadrant Planes, this activity is easy to differentiate to meet the needs of all your students. Includes "Coordinate Plane Graphing Battleship Game" Video InstructionsIf your students are unfamiliar with how to play Battleship, I included a video specifically using these worksheets with a QR Code on each page. Using the QR Code, students ca
Grades:
5th - 8th
Types:
CCSS:
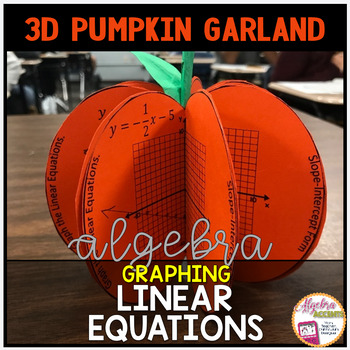
THANKSGIVING Algebra 1 Graphing Linear Equations Pumpkin Garland Math Activity
Students will practice graphing linear equations from Slope-Intercept Form, Standard Form and/or Point-Slope Form to create festive 3D autumn pumpkins for Halloween and Thanksgiving season. There are 60 linear equations (20 in each form) to provide students with multiple options and to allow for differentiated student assignments. This activity works well as a review of all types of graphing or can be spread out over a couple of days to cover all three types of linear forms.Hang the pumpkins o
Subjects:
Grades:
7th - 10th
Types:
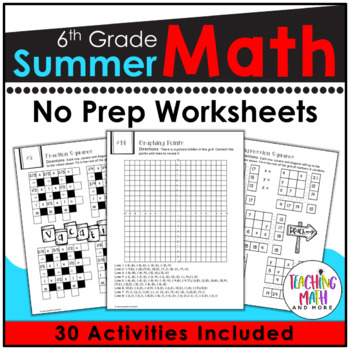
6th Grade Summer Packet | Summer Math Worksheets Grade 6
Need to review math skills? A Summer Math packet that your 6th grade students will want to complete! This packet is FUN and FULL of sixth-grade math problems. Students love the fun coloring, puzzles, and problem solving activities. Save 30% on this resource in the 6th grade math worksheets for the year!How to use it:1. A fun review at the end of 6th grade during May & June or after testing!2. A summer packet for students to complete at home during June, July, & August!3. A beginning of 7
Subjects:
Grades:
6th - 7th
Types:
Also included in: Math Worksheets 6th Grade BUNDLE
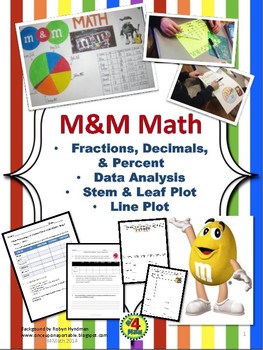
M&M Math: Fractions, Decimals, Percents, Graphs, & Data Analysis
These 3 sweet-filled activities and student project centered on data from bags of Fun-Sized M&Ms are a hit with my 5th graders! Students find the fraction, decimal, and percent of each color in their M&Ms bag and create a project displaying their data on a table and a circle graph. Students share their percentages with the class and work in groups to analyze the data. Line Plots are created from the number of M&Ms in their bags and Stem & Leaf Plots are created from the percents
Subjects:
Grades:
4th - 7th
Types:
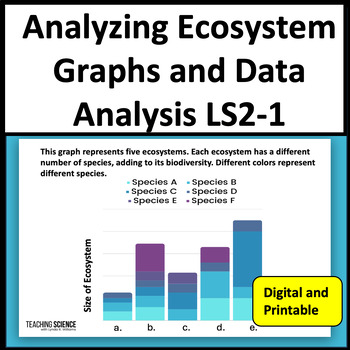
Analyzing Ecosystem Graphs & Data Analysis Resource Availability MS LS2-1
Do your students need practice with analyzing ecosystem graphs? These science graph worksheets include data analysis on resource availability in ecosystems. Students will use critical thinking to answer the questions. Great for Science TEST Prep! This set includes 20 pages of science graphs and diagrams with questions. You will get a printable PDF with a link to Google Slides. Great for CAST and STAR Test Prep.This Ecosystem Graph Practice Unit Includes:•20 printable pages of charts and diagrams
Subjects:
Grades:
6th - 8th
Types:
NGSS:
MS-LS2-1
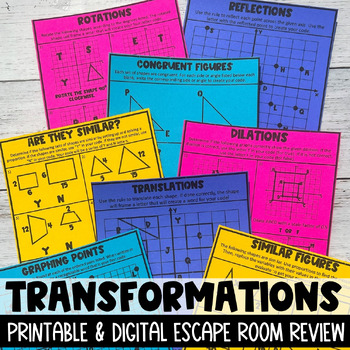
Transformations Review Escape Room | Reflection Dilation Translation Rotation
An engaging math escape room, focusing on essential transformation skills, that includes 8 creative challenges to hold students' attention while providing rigorous practice, making teachers and students happy! Perfect for your 8th graders, high school Geometry, or home school students, this resource is a perfect review for the beginning of the school year, after a break, during your Transformations unit, or before state testing!Included in this resource is:8 uniquely crafted worksheets that prov
Grades:
7th - 10th
Types:
CCSS:
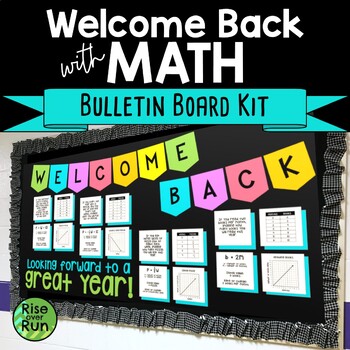
Welcome Back to School Bulletin Board Kit for Math Classroom Decorations
Welcome students with eye-catching math classroom decoration! This board will get students thinking about graphing and real world linear relationships in a fun way. Included are pennants to spell out “Welcome Back” and letters to spell out “Looking forward to a great year!” Four sets of linear functions are included. Each one has a story, an equation, a table of values, and a graph. This bulletin board would be perfect for a secondary math classroom or in a hallway. The math relates to math
Subjects:
Grades:
7th - 12th
Also included in: Math Bulletin Boards Bundle for All Year
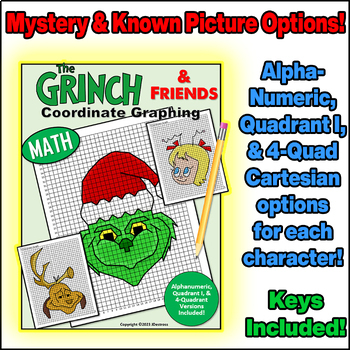
The Grinch & Friends Coordinate Graph Mystery Pictures! Christmas Math Graphing!
Alphanumeric, Quadrant I, and Full Cartesian Grid versions of each picture are included!Coordinate Plane Graphing can be fun, and the pictures students graph don’t have to be boring!Each character comes with blank coordinate planes and complete instructions to graph them.All of my coordinate graphs use whole numbers... No fractions or decimals to confuse the graphing!In this set, you will find 3 versions of the project for each character (The Grinch, Max, & Cindy Lou Who):*For graphing begin
Subjects:
Grades:
3rd - 8th
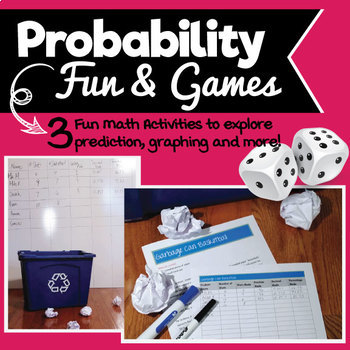
Probability Fun & Games! Exploring fractions, decimals, percentages & more!
Probability Fun & Games reinforces the concepts of: addition, prediction, graphing, fractions, decimals, and percents through three fun activities. Your students will be on the fast track to learning basic math skills. The packet include three activities - Roll Them Bones, Trash Can Basketball and What Color is Your Candy.
Included in this download are:
• Note to teacher with tips on using lessons
• Three activities with instructions
• Discussion prompts
• Ready-made charts for students to
Subjects:
Grades:
3rd - 8th
Types:
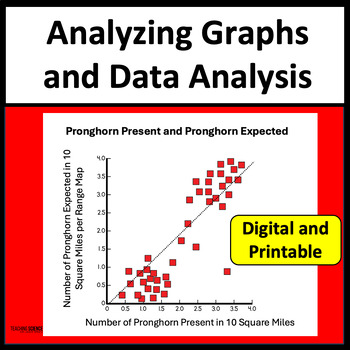
Analyzing Graphs and Data Analysis Middle School Science Test Prep and Practice
Do your students need practice with analyzing graphs? These science graph worksheets include data analysis with different types of graphs. They are great for science test prep and critical thinking. This set includes 25 pages of science graphs with questions. You will get a printable PDF with a link to Google Slides.This Ecosystem Graph Practice Unit Includes:25 printable pages of charts and diagrams with questions(Google Slides and Printable PDF)Answer KeysTwo simplified graphing pages for diff
Subjects:
Grades:
6th - 8th
Types:
Showing 1-24 of 709 results


