94 results
7th grade problem solving decimals resources for Microsoft Excel
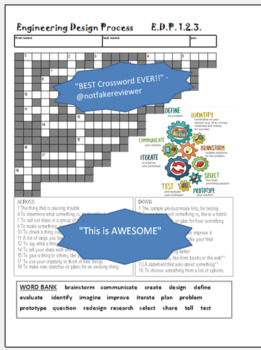
Engineering Design Process - CROSSWORD PUZZLE #2 STEM -Problem Solving -20 Clues
This 20 Clue Crossword puzzle covers the basics of the EDP steps. The answers can be found on the EDP graphic right there on the page!! Word bank & KEY included. SAMPLE CLUES:1 The thing that is causing trouble 4 To determine what something is, to describe it 7 To call out ideas in a group of people 9 To make something, especially something new. 10 To check a thing out, to see if it works right 11 A list of steps you decide on so you can reach a goalThe complete Word Bank:brainstorm
Subjects:
Grades:
7th - 9th
Types:
Also included in: STEM / Engineering Design Process BUNDLE
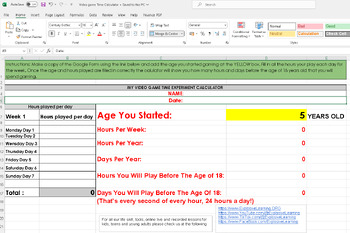
Screen Time Calculator or Video Game Time Calculator Excel sheet
Discover the power of time management with our "Video Game Time Experiment Calculator"! This interactive Excel tool is perfect for educators and parents looking to provide a practical lesson on screen time awareness. With a user-friendly interface, the calculator allows users to input the age they began playing video games and track the hours spent gaming each day. By projecting these figures up to the age of 18, it offers an eye-opening forecast on the total time dedicated to gaming, emphasizin
Subjects:
Grades:
4th - 12th, Higher Education, Adult Education, Staff
Types:
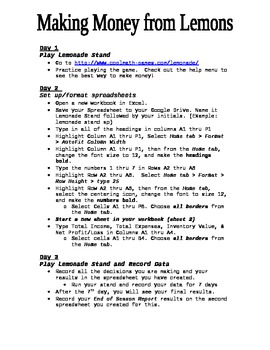
Making Money from Lemons--Microsoft Excel 2010 Project
This is an updated version of a previously posted project. This version is updated to reflect the Microsoft Office 2010 format. Students play a fun game that requires them to figure out how to make the most profit from their own "Lemonade Stand". Students will learn to create a spreadsheet that keeps track sales profit and loss. They will also create a graph that shows a sales report at the end of their "season".
Grades:
7th - 12th, Adult Education
Types:
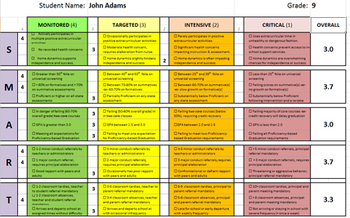
RTI: SMART Student Expectations Rubric
A dynamic rubric in Excel format that allows support teams to screen the needs of students based on a set of five criteria:
* Social/Emotional
* Measured Outcomes
* Academics
* Respect/Responsibility
* Timeliness
The results are then graphed on a spiderweb graph to show the targets for student intervention. The visual allows users to better understand the interaction of those expectations on the student's performance.
The rubric can support positive behavioral supports, Response to Intervention
Grades:
6th - 12th
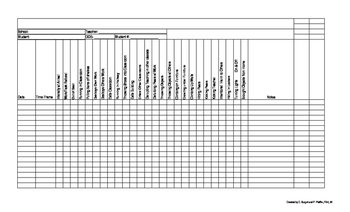
Student Behavior Log for RTI
This behavior checklist makes it quick and easy to document student behaviors without taking valuable class time away from teaching.
We developed this document to take to student invention meetings to show frequency, duration and intensity of each behavior that is interfering with learning.
Simply use one sheet per student. When a behavior is observed make a few check marks and you are back to doing that which is most important... teaching.
These documents are formatted for 8 1/2 x 14 pa
Grades:
PreK - 8th

iReady Diagnostic Data Spreadsheet
This is a simple to use spreadsheet where you can place all your student's iReady Diagnostic data. When you input their score in columns B & D, the cell will automatically change to the color for which grade your students scored in. This is specifically set up for 4th grade (You can change ranges based on the grade level you teach), so when your student scores within the 4th grade range it will change the cell color to green to show they are at grade level. If it changes to yellow, it shows
Subjects:
Grades:
K - 8th
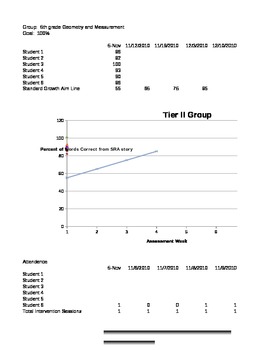
RTI small group graphing document to visualize student progression
This is a excel document you can use at the individual level for one student, or to track the entire school's RTI process. All you need to do is modify the headings to fit your school/class and the visual graph will automatically adjust to show student performance. You can type in what you want the baseline to be for student expected progression, and the graph will show how your student/s are progressing in relation to the mean. It can be applied to any content area as well as academic perfor
Grades:
PreK - 12th, Higher Education, Adult Education, Staff
Types:
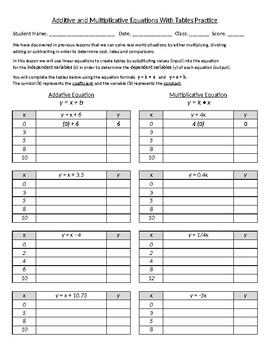
Create Tables With Additive and Multiplicative Equations
This activity is designed with Texas TEKS 6.6A, 6.6B, 6.6C and 6.4A.
Compare two rules verbally, numerically, graphically, and symbolically in the form of y = ax or y = x + a in order to differentiate between additive and multiplicative relationships.[6.4A]
Represent a given situation using verbal descriptions, tables, graphs, and equations in the form y = kx or y = x + b.[6.6C]
Grades:
6th - 7th
Types:
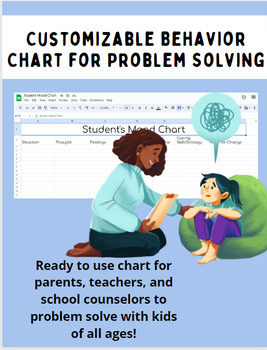
Customizable Behavior Chart for Problem Solving
Reactions to intense emotions usually go without thinking. This tool is to encourage reflection and identify the connections between thoughts, feelings (emotions and body reactions), and actions. This is a great way to helpidentify why they reacted, what coping skills can be used, and problem solve situations. This intervention works best when completed together, and the student/person can be guided through the sections.
Grades:
4th - 12th, Higher Education, Adult Education, Staff
Types:
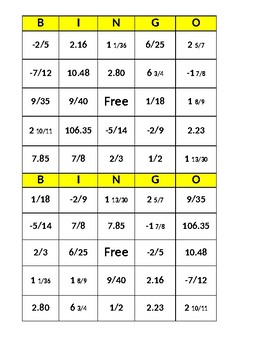
Math Bingo - Adding, Subtracting, Multiplying, Dividing Rational Numbers
ANSWER KEY IS IN THE PREVIEW ATTACHMENT. I used this math bingo activity as a way to review before a test for adding, subtracting, multiplying, and dividing fractions, mixed numbers, and decimals positive and negative. Students get to practice up to 23 problems and they don't even notice. The kids love it but be prepared to give out prizes.I always give out a small prize from the dollar store. First print out each of the 8 sheets in excel one by one. Cut each page in the middle to form two bingo
Subjects:
Grades:
7th
Types:
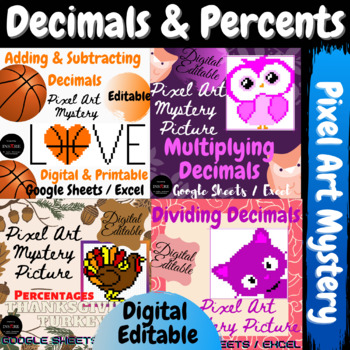
Decimals & Percents Percentage Math Pixel Art Mystery Activities BUNDLE EDITABLE
This is a perfect end of the year, back to school, math center, summer camp, or summer school math bundle (adding, subtracting, multiplying, and dividing decimals, markup, markdown, percent of change, convert percent to decimal, convert decimal to percent, percent of number):1. Pixel Art Mystery - Multiplying Decimals Owl - Digital in Google Sheets™/ Excel™.2. Pixel Art Mystery - Dividing Decimals Kitty - Digital in Google Sheets™/ Excel™.3. Pixel Art Mystery - Percentages Turkey - Digital in Go
Subjects:
Grades:
5th - 7th
Types:
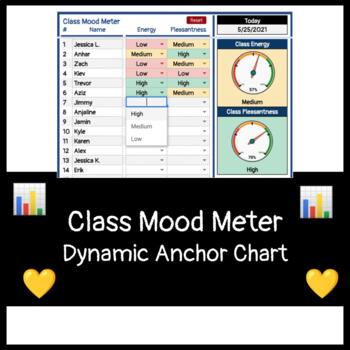
Class Mood Meter Dynamic Anchor Chart
This class mood meter was a helpful way for my students to check in every morning and feel validated about how they were feeling as we started the day.To use this resource, all you need to do is:Type in your students' names.When students gather at circle time or morning meeting, use the pre-built drop-down menus to capture each student's energy and pleasantness levels.Clear out the spreadsheet of the students' choices with one click. You're ready for the next morning's check-in!With this resour
Grades:
K - 8th
Stock Market PBL
The problem based learning activity presents middle school students with the opportunity to buy and sell stocks. The students are responsible for researching and buying stocks, creating and maintaining an Excel spreadsheet, and tracking the profits and losses for a given time period.
Subjects:
Grades:
6th - 8th
Types:
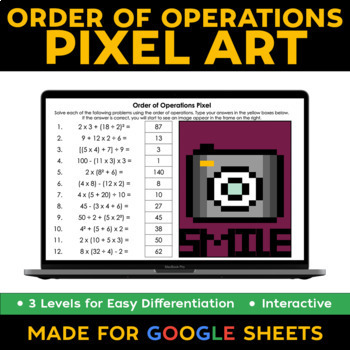
Order of Operations Digital Pixel Art - 3 Levels for Easy Differentiation!
Allow students the opportunity to practice independently with immediate feedback!Students solve each problem and enter their answer in the highlighted box. Incorrect answers are immediately identifiable through red text. Correct answers automatically reveal the corresponding pixels. This product includes 3 LEVELS for easy differentiation! Each level includes 12 practice problems.Level 1 - Order of Operations without ExponentsLevel 2 - Order of Operations with ExponentsLevel 3 - Order of Operatio
Subjects:
Grades:
5th - 7th
Types:
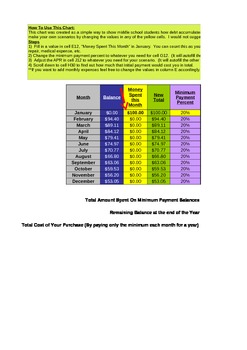
Why Paying the Minimum is Bad - Credit Card Debt Calculator - Percents
This Excel file is set up to show students how quickly debt can add up if they only pay the minimum balance on a credit card. The spreadsheet is already formatted to do the calculations for you! All you have to change is your initial credit card balance and change the APR and minimum payment balance to fit different scenarios. This is a quick way to show your students the "big picture" when it comes to credit card debt. It is also a nice way to introduce students to applications of percents
Subjects:
Grades:
7th - 10th
Types:
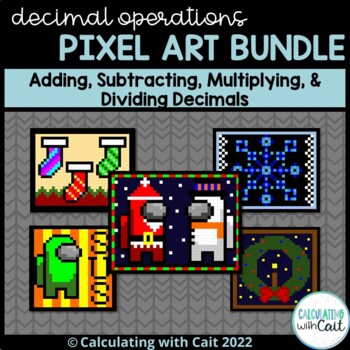
Decimals Pixel Art Bundle
Included are 4 decimal pixel art activities that can be used with google sheets-1 adding decimals-1 subtracting decimals-1 multiplying decimals-1 dividing decimalsAlso included is 1 multiplying whole numbers pixel art activity that can be used with google sheets. Each pixel art has 15 questions.
Subjects:
Grades:
5th - 7th
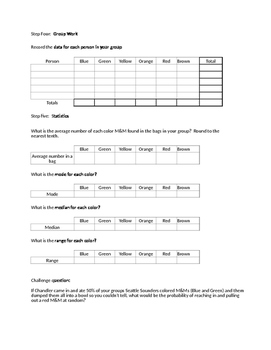
M & M Review Activity
This activity tests students on their knowledge of fractions, decimals, and percents. It also test probability, statistics, and graphing. To make the activity easier presort bags of M&M to ensure easy fractions. Use fun-size bags to make the activity shorter. Use regular size bags or tubes of mini M&M to stretch the activity out and/or make it more challenging.
The activity asks students to sort a bag of M & M into colors and record the information on a table. Then students a
Subjects:
Grades:
3rd - 7th
Types:
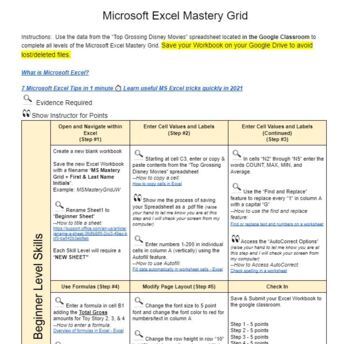
Microsoft Excel Mastery Grid
Inspired by the grid method created by Chad Ostrowski, this mastery grid will open the door for students with diverse skill levels and educational backgrounds to learn how to use Microsoft Excel.This project is not about the "what", but more so about the "how".Students will have to research how to perform the requested skills and apply them in an excel spreadsheet. The only thing I had to teach the class was how to save a spreadsheet (If you don't operate in a computer lab where their files can
Grades:
6th - 12th
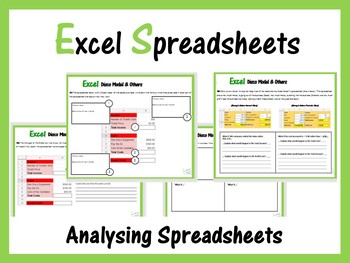
Microsoft Excel - Analysing Spreadsheets
This set of worksheets expects students to read the scenarios and answer the questions associated with them.
Student will be expected to recall their knowledge on using the following calculations:
= sum()
multiplication
subtraction
what if questions
making predictions based on data held in spreadsheets.
These worksheets can be used as part of the main lesson or for homework.
Many thanks to KindergartenWorks for use of font LesliesHand: https://www.teacherspayteachers.com/Product/Kindergarte
Grades:
5th - 11th, Adult Education, Staff
Types:
Also included in: Microsoft Excel Spreadsheets Ultimate Bundle - Computer Applications
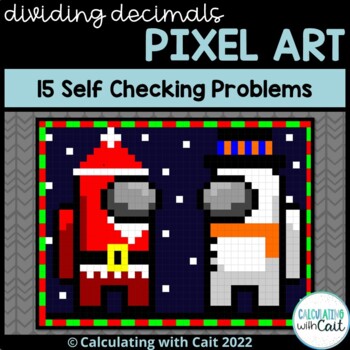
Dividing Decimals Pixel Art - Christmas Among Us
15 questionsSelf checkingGoogle sheetsPicture created is an Among Us character
Subjects:
Grades:
5th - 7th
Also included in: Decimals Pixel Art Bundle
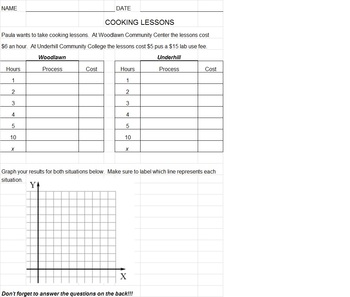
Proportional Non Proportional Comparison Cooking Lessons
Students will use tables, graphs and equations to describe two costs of cooking schools. They will use this information to compare and contrast proportional and non proportional graphs, tables, and equations. I used this as a test.
Subjects:
Grades:
6th - 8th
Types:
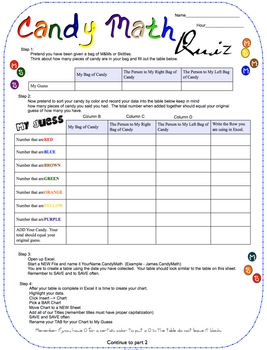
Candy Math Quiz for Grades 3-8
This quiz is a fun way to assess your students in their chart making skills in Excel along with their problem solving skills.
Part 1 of the quiz students are to pretend they have been given a bag of candy. They are to create a table then a chart with their data.
Part 2 of the quiz you give your students candy and this time they have to record the actual amount and make a table and a chart.
Part 3 of the quiz test basic formula writing.
Common Core - 3.MD.3. Draw a scaled picture graph and
Subjects:
Grades:
3rd - 9th
Types:

Auto Evaluation sheet for Teachers - Design Projects
This excel file will help teachers to evaluate, calculate marks and comment design project documentation of the students based on predefined strands. Teachers needs to select appropriate keywords and marks from the dropdown which define the student's performance and quality. This will automatically calculate the total marks and ease the documentation process for the teachers. Comments for strands, criterion based marks and total marks are kept organized and this will help in effective analyzing
Subjects:
Grades:
4th - 10th
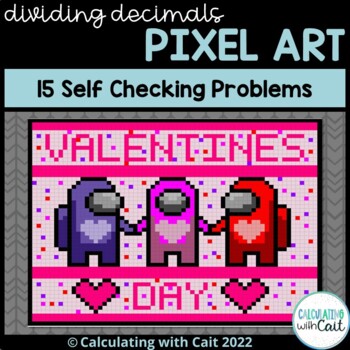
Valentine's Day Among Us Dividing Decimals Pixel Art
Pixel image of Among Us characters created in google sheets requires students to correctly answer 15 questions. All divisors are whole numbers. Quotients terminate.
Subjects:
Grades:
5th - 7th
Also included in: Valentine's Day Among Us Decimal Operations Pixel Art
Showing 1-24 of 94 results


