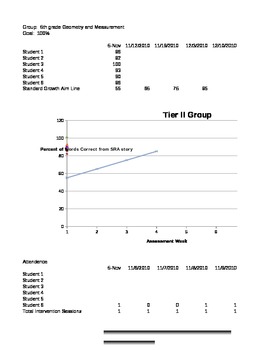
RTI small group graphing document to visualize student progression
Cameron Lazar
7 Followers
Grade Levels
PreK - 12th, Higher Education, Adult Education, Homeschool, Staff
Subjects
Resource Type
Formats Included
- XLSX
Cameron Lazar
7 Followers
Description
This is a excel document you can use at the individual level for one student, or to track the entire school's RTI process. All you need to do is modify the headings to fit your school/class and the visual graph will automatically adjust to show student performance. You can type in what you want the baseline to be for student expected progression, and the graph will show how your student/s are progressing in relation to the mean. It can be applied to any content area as well as academic performance, attendance tracking, and/or behavior. It is also a wonderful tool for behavior modification programs and interventions. This is a fantastic tool for parent-teacher conferences, and leaves nothing up to subjectivity. I know it will be as helpful to you as it has been to me. I have used this document as a teacher and also as an administrator.
Total Pages
Answer Key
N/A
Teaching Duration
N/A
Report this resource to TPT
Reported resources will be reviewed by our team. Report this resource to let us know if this resource violates TPT’s content guidelines.


