TPT
Total:
$0.00

Eye Color: The Magic of Genetics Reading Passage and Graphing Worksheet

Rated 3 out of 5, based on 1 reviews
3.0 (1 rating)
;
EducationalResource
69 Followers
Grade Levels
3rd - 6th
Resource Type
Standards
Formats Included
  • Google Docs™
Pages
1 page
$0.50
$0.50
Share this resource
Report this resource to TPT
EducationalResource
69 Followers
Made for Google Drive™
This resource can be used by students on Google Drive or Google Classroom. To access this resource, you’ll need to allow TPT to add it to your Google Drive. See our FAQ and Privacy Policy for more information.

Description

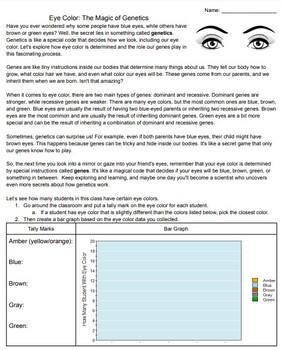
This is a worksheet and practice in collecting data and representing it in bar graph form, and is designed to help students understand the fascinating role of genetics in determining eye color.

In this activity, students will explore the concept of genetics as a special code that influences our physical appearance, including eye color. They will learn that genes act as tiny instructions within our bodies, inherited from our parents at birth. This hands-on activity and reading passage will help students discover the magic behind eye color inheritance.

The worksheet guides students through an explanation of dominant and recessive genes. To make the learning experience even more interactive, the worksheet includes a fun get-to-know their peers activity. Students will go around the classroom and collect data on the eye color of their peers, recording the information using tally marks. They will then use this data to create a bar graph, visually representing the eye color distribution within the class.

The worksheet encourages students to observe and categorize eye colors, even if they differ slightly from the listed options.

This resource is ideal for 3rd to 6th-grade students. It introduces complex scientific concepts in a relatable manner, hopefully sparking their curiosity. By the end of this activity, students will have a deeper understanding of genetics and its influence on eye color.

For more worksheets, labs, activities, and videos for elementary education, visit EducationalResource.org.

Total Pages
1 page
Answer Key
N/A
Teaching Duration
45 minutes
Report this resource to TPT
Reported resources will be reviewed by our team. Report this resource to let us know if this resource violates TPT’s content guidelines.

Standards

to see state-specific standards (only available in the US).
Draw a scaled picture graph and a scaled bar graph to represent a data set with several categories. Solve one- and two-step “how many more” and “how many less” problems using information presented in scaled bar graphs. For example, draw a bar graph in which each square in the bar graph might represent 5 pets.
Ask and answer questions to demonstrate understanding of a text, referring explicitly to the text as the basis for the answers.
NGSS3-LS3-1
Analyze and interpret data to provide evidence that plants and animals have traits inherited from parents and that variation of these traits exists in a group of similar organisms. Patterns are the similarities and differences in traits shared between offspring and their parents, or among siblings. Emphasis is on organisms other than humans. Assessment does not include genetic mechanisms of inheritance and prediction of traits. Assessment is limited to non-human examples.

Reviews

Questions & Answers

69 Followers