207 results
Thanksgiving statistics resources for Microsoft Excel
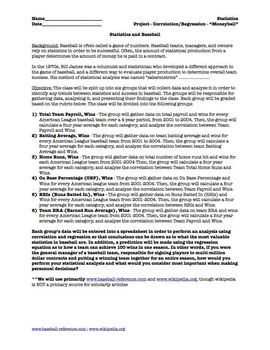
Statistics Correlation and Regression Project for Movie "Moneyball" (5 day)
Prerequisite: Correlation and Regression (Linear). This is a project that divides a statistics class into 6 groups and students do ACTUAL data collection from given websites and they perform their OWN ANALYSIS. They will use computers/internet/excel/spreadsheets/graphing calculators to evaluate correlation. If you have interest in baseball and statistics, this is a great project to get the class interested, and covers about 5 days, plus you can watch the movie "Moneyball" afterwards as a reward.
Subjects:
Grades:
10th - 12th, Higher Education, Adult Education
Types:
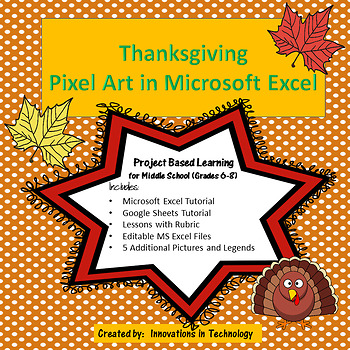
Thanksgiving Pixel Art in Microsoft Excel or Google Sheets | Distance Learning
Need a fun way to introduce Microsoft Excel or Google Sheets to upper elementary or middle school students? This great lesson incorporates Thanksgiving themed art as students learn the basics of either Microsoft Excel or Google Sheets. First, they'll create a quick pixel art from a given example and then they'll create their own! A full tutorial is included for both Microsoft Excel and Google Sheets. These are also fun lessons to use if you just need something for a one day lesson.This lesso
Grades:
6th - 8th
Types:
Planning Thanksgiving Dinner Computer Activity Google Sheets Microsoft Excel
UPDATED 4/26/24 - 9 Additional Images, ALL NEW Images & Updated 2024 Food PricesStudents will learn real-life skills planning their own Thanksgiving Dinner with a budget of $200.00. Students will shop using the colorful 3-page Thanksgiving Foods handout while carefully planning for enough servings for everyone.Students should be somewhat familiar with how to multiply and add in Google Sheets/Microsoft Excel. The lesson sheet does help students with calculations by showing them how to calcula
Subjects:
Grades:
6th - 12th
Types:
CCSS:
12 Days of Christmas: A Computer Spreadsheet Activity
This great holiday activity shows students how to use a computer spreadsheet to calculate the cost of their true love's gifts in today's dollars.The simple step-by-step procedure will allow both beginning and computer-savvy students to experience success as they learn how to use spreadsheet software. Students will enjoy the engaging and entertaining activity. No computer? No problem! Use the activity master so students can calculate the costs themselves.
Grades:
5th - 9th
Types:
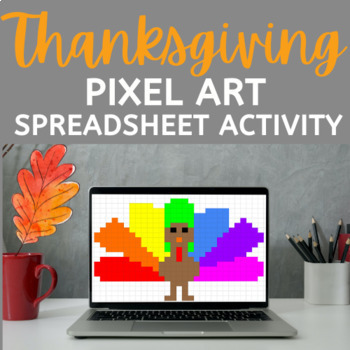
Thanksgiving Pixel Art Spreadsheet Activity
In this fun Thanksgiving Pixel Art Activity students will follow 68 spreadsheet formatting directions in order to create a pixel art image of a colorful turkey!Each formatting direction includes a check box so students can check off each step as they complete it (You can also print directions for students!)Formatting directions include resizing columns, creating a custom fill color, and changing the fill color of cellsCompatible with Google Sheets or Microsoft ExcelAnswer key included!Looking fo
Grades:
6th - 12th
Types:
Also included in: Holiday Pixel Art Bundle
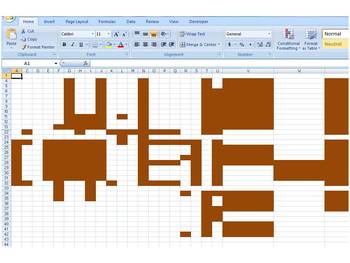
Microsoft Office Excel Hidden Thanksgiving Message Activity
Students will hide and unhide rows and columns, delete and insert cell ranges, and perform other Excel formatting tasks to decode the hidden Thanksgiving message! A fun activity before the holiday to reinforce Excel formatting skills. Step-by-step instructions to unravel the message are included on sheet 2 of the Excel workbook. Use in Computer Applications in Business or other course that teaches Excel spreadsheets.
Grades:
7th - 12th
Types:
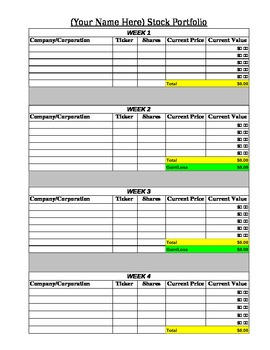
Stock Market Portfolio Tracking Spreadsheet
This document is an Excel spreadsheet which has already been formulated for students to use as part of a Stock Market unit. As students research and track their stocks, they will enter their data into the spreadsheet and their profit/loss will be automatically calculated along with a graph for students to analyze their results.
Subjects:
Grades:
4th - 8th
Types:
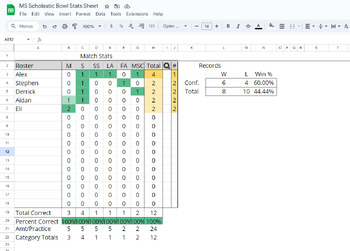
MS Scholastic Bowl / Quiz Bowl Stat Sheet
DISCLAIMER: Made for IESA-Compliant Scholastic Bowl. 24 questions per round, 10 point toss-ups, 4 part bonus (each bonus worth 5 points).This is a stat sheet for MIDDLE SCHOOL Scholastic Bowl/ Quiz Bowl practices and games. It adapts in real-time to update the scoreboard and team totals when a name and category abbreviation is applied (see thumbnails for example) The sheet tracks math, science, social studies/history, language arts, fine arts, and miscellaneous questions. It is incredibly useful
Subjects:
Grades:
6th - 8th
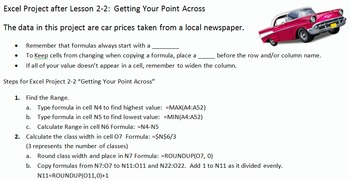
Excel Projects for Statistics Frequency Distributions and Charts
This file contains three different projects with solutions and a quick reference card for students. It correlates to Bluman's Elementary Statistics textbook.
First is an Introduction to Excel. There is an example, guided practice and then 4 Projects. The instructions are on each sheet. The topics covered are: basic editing and formatting, beginning charts, beginning formulas, such as SUM and AVERAGE, and calculations. There is an editable grading rubric for this project. The Preview file
Subjects:
Grades:
8th - 11th, Higher Education, Adult Education
Types:
Google Sheets Thanksgiving Activity
Get in the Thanksgiving spirit by having students follow step by step instructions in order to create a Thanksgiving Dinner Budget in Google Sheets! There are a total of 17 steps. Each step is clearly explained in a google slides presentation (one step per slide). You can give a copy of the directions to the students or display it on your projector/smartboard & have students follow along with you! Students will practice spreadsheet skills such as locating cells, formatting cells, sorting inf
Grades:
6th - 12th, Higher Education
Types:
Also included in: Computer Applications Holiday Bundle
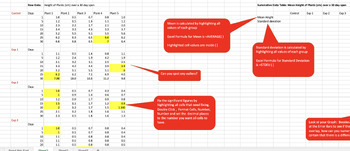
Bundle - Help with Science Fair Table, Graphs, Statistics using Excel.
This comprehensive 3-part bundle comprises a video tutorial, an informative handout, and an Excel file meticulously guiding students through a step-by-step process. The aim is to empower students with the skills to transform raw data into concise summative data tables and graphs, complete with standard deviation error bars. The tutorial covers the entire spectrum – from utilizing Excel for table and graph preparation to conducting statistical analyses using Anova tests, t-tests, or correlation m
Subjects:
Grades:
9th - 12th
Types:
Statistics Unit 9 Bundle - Hypothesis Testing (one sample) (18 days)
This is a unit plan bundle for a Statistics class. The plans include common core math standards, time frame, activities, enduring understandings, essential questions, and resources used. It is designed to last 18 days, depending on pacing. The plans include: 56-slide presentation, with annotated guide for reference5 Worksheets1 "Read & Respond" Article Worksheet2 Quizzes"Do Now" Entrance problemsSpreadsheet Activity - Hypothesis TestingReview slides (for peer presentations)Unit ReviewUnit Te
Subjects:
Grades:
10th - 12th, Higher Education
Types:
CCSS:
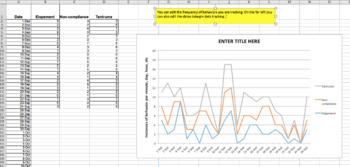
More Graphs Added! Graphing Basic Data For Students: An Excel Workbook
This is a great resource to use for data tracking for all of your students or clients. I have expanded the other Graphic Workbook on my TPT store. This resource is made to easily create graphs for a variety of skills or behaviors. As a result, this excel workbook can be used by teachers, behavior analysts, speech therapists, behavior intervention specialists, really anyone who needs data collection. The graphs can be shared during parent-teacher conferences, IEP meetings, included in student pro
Subjects:
Grades:
Not Grade Specific
Types:
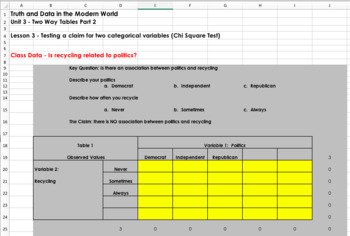
Teaching Statistics with Spreadsheets (Self Grading)
You can see a video that describes the basics of this course at the following link: https://www.youtube.com/watch?v=uZFpltXWyw8This package is an entire statistics course designed for content to be delivered, taught, practiced, and assessed through spreadsheets. Students learn basic statistics and spreadsheet skills. This course is intended to allow for student collaboration and group work throughout the learning process. Each spreadsheet is automatically graded so students can see their progres
Grades:
9th - 12th
Types:
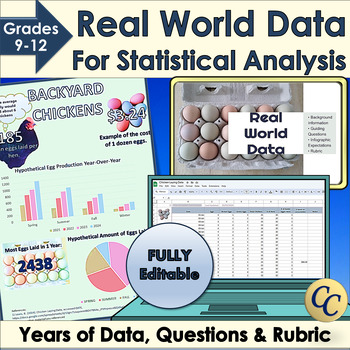
Real World Data for Statistical Analysis and Infographic Project
Give your students access to real world data for your statistical analysis unit or data literacy! Dive into statistics with Microsoft Excel™ or Google Sheets™ and years of data. Learn how to use standard deviation, mean or median to interpret data. Choose the best graphs to display conclusions in an infographic. Works great for science fairs! ✔ Includes an infographic project! (Template, expectations, and rubric). ✔ Everything is fully editable and you and your students can even use the images
Grades:
9th - 12th
Types:
CCSS:
VM Numeracy Unit 2 - Civics - Data and Uncertainty
VCE VM Unit 2 Numeracy book, Civic - Data and Uncertainty. This unit looks at odds, reading and interpreting data, probability and statistics. Includes many hands-on activities.
Subjects:
Grades:
10th - 12th
Types:
Also included in: Bundle 1
Statistics Unit 8 Bundle - Confidence Intervals (19 days)
This is a unit plan bundle for a Statistics class. The plans include common core math standards, time frame, activities, enduring understandings, essential questions, and resources used. It is designed to last 19 days, depending on pacing. The plans include: 52-slide presentation, with annotated guide for reference5 Worksheets3 Quizzes"Do Now" Entrance problemsSpreadsheet Activity - T-DistributionReview slides (for review response system)Unit test (with review packet)Unit Project - Gather Data,
Subjects:
Grades:
10th - 12th, Higher Education
Types:
CCSS:
Microsoft Excel Thanksgiving Activity
Get in the Thanksgiving spirit by having students follow step by step instructions in order to create a Thanksgiving Dinner Budget in Microsoft Excel! There are a total of 18 steps. Each step is clearly explained in a powerpoint presentation (one step per slide). You can give a copy of the directions to the students or display it on your projector/smartboard & have students follow along with you! Students will practice excel skills such as locating cells, formatting cells, sorting informatio
Grades:
7th - 12th
Types:
Also included in: Microsoft Activities Bundle
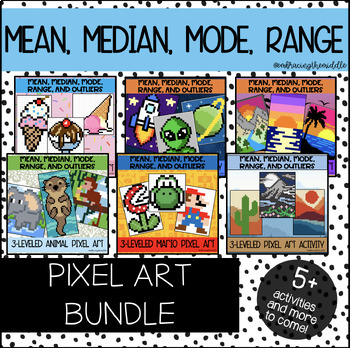
Mean, Median, Mode, and Range Pixel Art BUNDLE for Middle Schoolers | Math
This growing bundle will provide you with 6 pixel art activities that can help deepen student understanding of mean, median, mode, range, and outliers. These pixel art activities have three different levels of knowledge. Gives teachers more flexibility to support individual student needs. This resource can be used in the classroom as a formative assessment, independent classwork, homework, or much more! Students will solve 10 mean, median, mode, and range problems to reveal a mystery image. Give
Subjects:
Grades:
6th - 8th
Types:
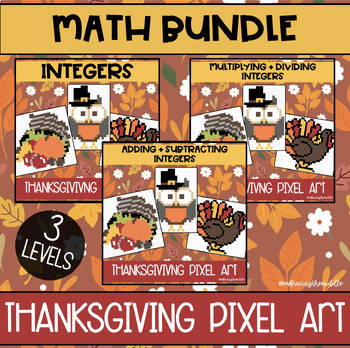
Thanksgiving Themed Pixel Art BUNDLE for Middle School Math
This bundle will provide you with 5 pixel art activities that can help deepen student understanding of middle school math concepts. These pixel art activities have three different levels of knowledge. Gives teachers more flexibility to support individual student needs. This resource can be used in the classroom as a formative assessment, independent classwork, homework, or much more! Students will solve 10 integer problems to reveal a mystery image. Gives students automatic feedback and is no pr
Subjects:
Grades:
6th - 8th
Types:
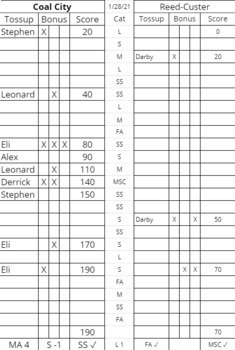
Quiz Bowl/ Scholastic Bowl adaptive stat sheet
DISCLAIMER: Made for IHSA-Compliant Scholastic Bowl. 24 questions per round, 10 point toss-ups, 3 part bonus (each bonus worth 10 points).This is a stat sheet for Scholastic Bowl/ Quiz Bowl practices and games. It adapts in real-time to update the scoreboard and team totals when a name and category abbreviation is applied (see thumbnails for example) The sheet tracks math, science, social studies/history, literature, fine arts, and miscellaneous questions. It is incredibly useful and semi-autono
Subjects:
Grades:
9th - 12th
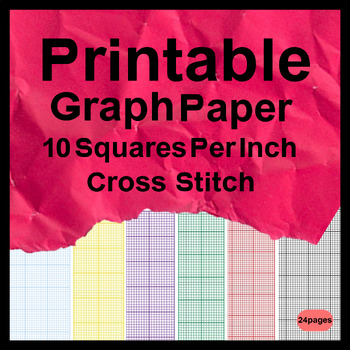
Printable Graph Paper 10 Squares Per Inch Cross Stitch
Printable Graph Paper 10 Squares Per Inch Cross Stitch - Grid paper is essentially the type of paper most commonly used for drawing and sketching purposes. It is widely used for making plan charts, designing websites, developing home ideas and so forth. A great deal of businesses who need to produce a company card, business brochures, catalogues, brochures, and so forth need this kind of graph paper.
Subjects:
Grades:
5th - 12th
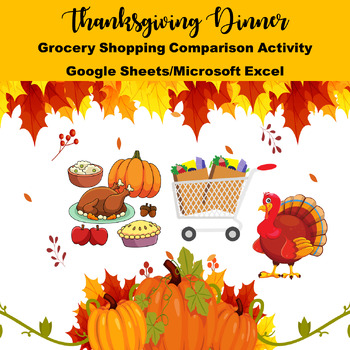
Thanksgiving Dinner Comparison Shopping Google Sheets Microsoft Excel
Students will use either Google Sheets or Microsoft PowerPoint (downloads in Google Sheets and works perfectly in PowerPoint) to comparison shop two major chain stores with their local grocery store. The spreadsheet downloads with 19 Thanksgiving grocery items to online shop, spreadsheet calculations completed so student focus on shopping, a short presentation to introduce the activity and how to comparison shop, 8 reflection questions, and optional activities that include two charts and a condi
Subjects:
Grades:
6th - 12th
CCSS:
Presidential Data Analyst Math Project | Excel | Presentations | Presidents Day
Elevate your Presidents' Day lesson plans with this comprehensive Presidential Data Analysis Math Project, designed to engage students in a deep exploration of U.S. presidential history through mathematical analysis. This invaluable resource provides educators with everything they need to guide their students through a dynamic and informative project that combines historical research with mathematical concepts.**Key Features:**1. **Thematic Relevance:** - Aligned with Presidents' Day, this o
Subjects:
Grades:
7th - 10th
Showing 1-24 of 207 results


