TPT
Total:
$0.00
Selected

Subjects

Arts & Music
English Language Arts
Foreign Language
Holidays/Seasonal
Math
Science
Social Studies - History
Specialty
For All Subject Areas
300 results

Summer graphing resources for Microsoft Excel
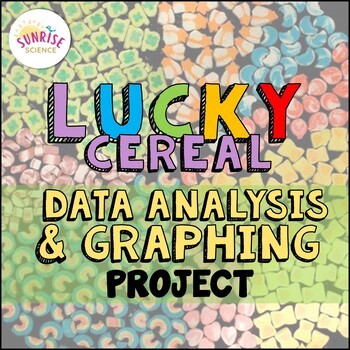
Preview of Lucky Charms Cereal Data Analysis and Graphing Project St. Patrick's Day
Lucky Charms Cereal Data Analysis and Graphing Project St. Patrick's Day

Created by
Sunrise Science
Looking for a way to review data analysis and graphing skills without it being a bore? This Lucky Charms Cereal Data Analysis and Graphing Project is a fun activity to incorporate in March for St. Patrick's Day, but of course it works at any time of the year in a graphing unit or in a math-integrated unit. Your students will smile when you whip out the box of Lucky Charms and tell them that they are to pretend they are the Quality Control Department at the Cereal Company! This activity is fun an
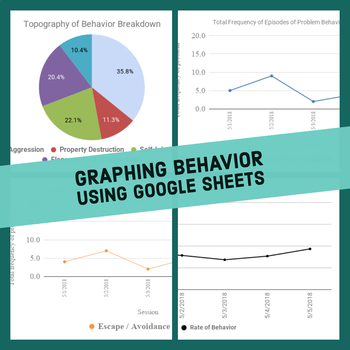
Preview of ABA Behavior Graph Excel Workbook

ABA Behavior Graph Excel Workbook

You do not need to purchase multiple licenses; feel free to use with as many clients as you want.Note: Email me at ian.vignes@atlasautismcenter.com for a link to the google sheets version, once you've made your purchase.Description: This file graphs behavior data for a single client. In it's current format, it records frequency and rate of behavior, as well as frequency of function of behavior. In addition, there is a pie chart breakdown of the percentage of each topography of behavior. For an
Preview of Excel Lessons - Creating Charts

Excel Lessons - Creating Charts

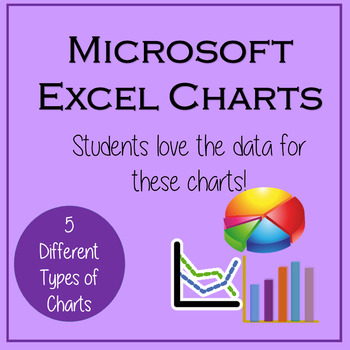
No Prep! These lessons are great as a first Excel Chart lesson or for students already a little familiar with creating charts. Students love the data for these charts because the data is centered around things they love – their cell phones! In Lesson 1, students will create 5 different charts from step-by-step directions which include Chart Titles, Chart Styles, Axis Titles, Data Labels, and Moving Chart to its own Sheet.In Lesson 2, students will create 5 charts from provided data as well as ch
Preview of Ordered Pairs Graphing Coordinate Plane Pixel Art Math | 5 Images | Editable
Ordered Pairs Graphing Coordinate Plane Pixel Art Math | 5 Images | Editable

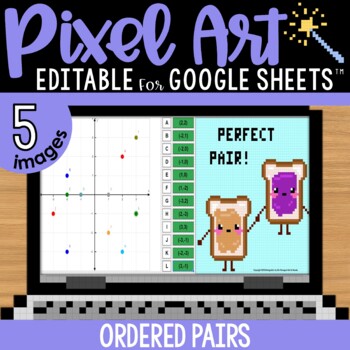
Ordered pairs mystery pixel art with a doubles / perfect pairs theme! Have students practice finding the location of a coordinate pair on a graph to AUTO-GENERATE one of 5 pixel art images in Google™ Sheets (or Microsoft Excel™) plus a "secret message."★ Low Prep: Just assign the sheet in Google Classroom. Each sheet includes all 5 images; students click the tabs at the bottom to advance to the next pixel image. There are 12 math problems per image to solve.★ Differentiated: Includes 4 versions
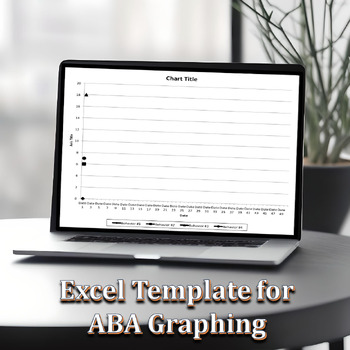
Preview of Excel Graphing Template for ABA

Excel Graphing Template for ABA

Created by
The ABA Nerd
Use this Excel template to create a line graph in proper ABA format for behavioral data. An example of a graph is provided in this template. You may graph up to 4 behaviors at a time. To use: 1. Open the Excel file2. Fill in the 4 behaviors you would like to graph at the top (to replace Beh #1, Beh #2, etc)3. Fill in the dates you have data for (this graph is designed to hold 50 days worth of data)4. Fill in your behavioral data in the columns for each behavior5. Watch your graph change as you t
Preview of Spreadsheet - Basics Introduction & Graphing (Excel and Google Sheets)
Spreadsheet - Basics Introduction & Graphing (Excel and Google Sheets)

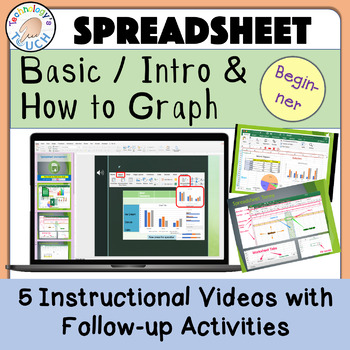
This lesson guides students via animation and a tutorial video before completing the assignments. This is completely paperless with no prep, and lessons are done on either Microsoft Excel or Google Sheets. Students learn to enter data and start graphing. This resource is intended for learners first starting out or those who need a reminder on using spreadsheets or creating graphs. If you want your students' research papers to include eye-catching graphs, give this lesson a try. Start the slides
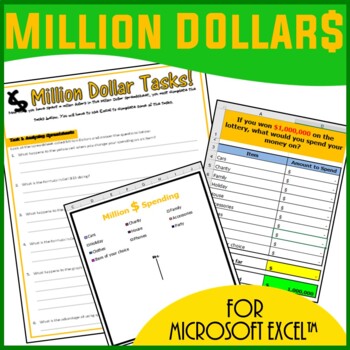
Preview of Excel Spreadsheets Million Dollars Activity
Excel Spreadsheets Million Dollars Activity

This resource allows students to understand the following: How graphs change when spreadsheet data is alteredUse of SUM() functionsHow graphs are madeComponents of a graphAdvantages of spreadsheets over pen and paper methodsStudents use this resource to understand how altering data in spreadsheets allow graphs to change. They understand such concepts by trying to spend a Million Dollars in a minute. Students are then expected to complete the associated worksheet which accompanies the spreadsheet
Preview of Digital Weekly Planning + To Do Agenda
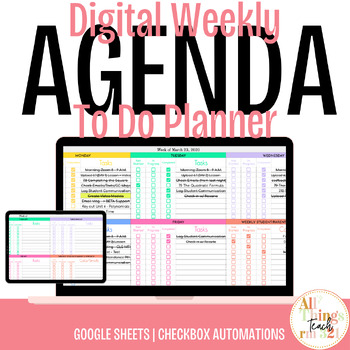
Digital Weekly Planning + To Do Agenda

*Updated August 3rd, 2022.Update includes new formatting.Update includes self set-up! Write in the dates by week, each week!Welcome! Check out the VIDEO CLIPS to this resource! VIDEO 1VIDEO 2I created this Digital Weekly Planner organizer during the Remote Learning education experience. I needed something to better organize the tasks I needed to do each day, and in order to stay motivated, I needed to see that I was checking things off my list every single day. I also needed to see how much prog
Preview of Graphing Basic Applied Behavior Analysis Data
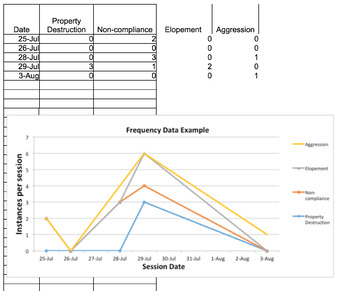
Graphing Basic Applied Behavior Analysis Data

This is a great resource for students or teachers that are new to learning how to graph frequency data (e.g., instances of aggression), accuracy data (e.g., % of correct sight words), baseline and treatment data, along with a few more. Each tab contains an example of data that is entered, as well as a (labeled) graph to accompany that data. It is very easy to edit and can be used to graph a multitude of different types of data. It is also a wonderful resource for therapists and other clinicians
Preview of Escape Room - No Code DIY - Excel

Escape Room - No Code DIY - Excel

Created by
Blue Milk
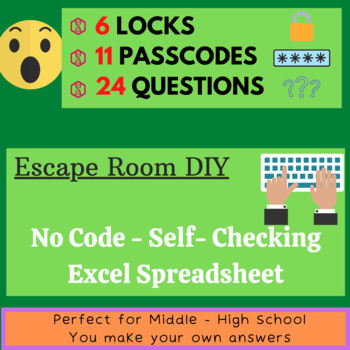
So ever searched TpT and haven't quite found the Activity you were looking for? Especially an Escape Room? Well look no further, this Zip file includes an Excel file and a pdf with instructions on how to create your very own Escape Room. There are 6 levels, each with 4 multiple choice questions and each has a lock to open and they are all colour coded. Not only do you input the questions/answers but you also can create the passcodes for the locks and the levels. The Excel file is already set up
Preview of Computer Graphing for K-2  How Many Puppies?
Computer Graphing for K-2 How Many Puppies?

Created by
That Tech Chick
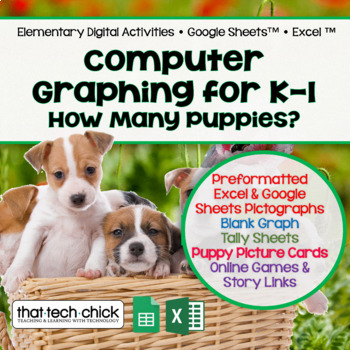
This beginning graphing activity is a great way to differentiate and meet the needs of all your students as they count and sort four different super cute puppies into groups and record their numbers on tally sheets. Students who may struggle can be given fewer types of pictures to sort and/or count, while more advanced students can be challenged with more to count and sort. Once your students enter their data into a prepared spreadsheet, it will automatically create a pictograph!The preformatt
Preview of Patterns in Addition and Multiplication Printable Test Pack {3rd Grade Unit 3}
Patterns in Addition and Multiplication Printable Test Pack {3rd Grade Unit 3}

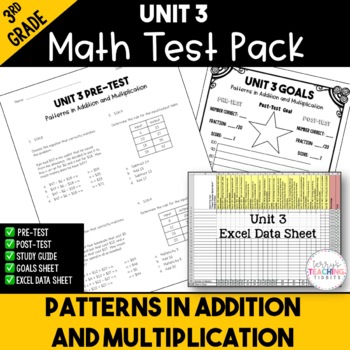
Make assessment administration incredibly easy with this printable test pack.What You Get:a printable pre-and post-test for the unit (20 questions, multiple choice)Excel data sheets to show student growth study guides to help students prepare for the post-testa student goals sheets for your class to track their growth from the beginning of the unit to the endA link to a tutorial video on how to use the Excel data sheetThis test is aligned to the Georgia Standards of Excellence Unit 3: Patterns i
Preview of More Graphs Added! Graphing Basic Data For Students: An Excel Workbook
More Graphs Added! Graphing Basic Data For Students: An Excel Workbook

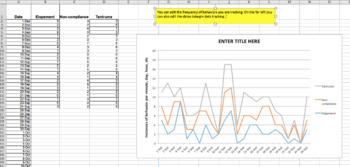
This is a great resource to use for data tracking for all of your students or clients. I have expanded the other Graphic Workbook on my TPT store. This resource is made to easily create graphs for a variety of skills or behaviors. As a result, this excel workbook can be used by teachers, behavior analysts, speech therapists, behavior intervention specialists, really anyone who needs data collection. The graphs can be shared during parent-teacher conferences, IEP meetings, included in student pro
Preview of Master Schedule editable template with designated blocks for STEAM& Intervention
Master Schedule editable template with designated blocks for STEAM& Intervention

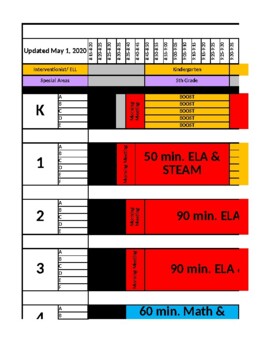
Master Schedule Best Practices SET YOUR NON-NEGOTIABLES FIRST The schedule needs to have these key components:1. Intervention Time (time for EC, Intervention and Enrichment) - those needs to be scattered throughout the day to ensure each division of the school (K-2, 3-5, 6-9) has specific time with the EC Teachers and Interventionist. Planning my SPED classes to build the most opportunity for inclusion or collaboration 2. Academic Education Plan: Are there specifics around how long certain acade
Preview of Real World Data for Statistical Analysis and Infographic Project
Real World Data for Statistical Analysis and Infographic Project

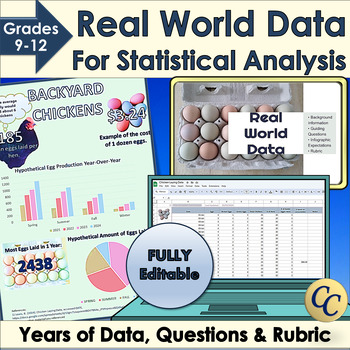
Give your students access to real world data for your statistical analysis unit or data literacy! Dive into statistics with Microsoft Excel™ or Google Sheets™ and years of data. Learn how to use standard deviation, mean or median to interpret data. Choose the best graphs to display conclusions in an infographic. Works great for science fairs! ✔ Includes an infographic project! (Template, expectations, and rubric). ✔ Everything is fully editable and you and your students can even use the images
Preview of Blank (line or bar) Graph

Blank (line or bar) Graph

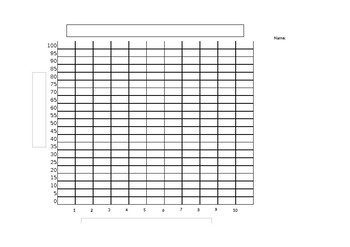
This product can be for multiple uses! It contains a numbered x and y axis, a blank heading for students to write in a title, and blank headings for axis labels.I used the blank graph for my students to graph their test scores and then mark their goal for their next test creating an accountability factor for testing.
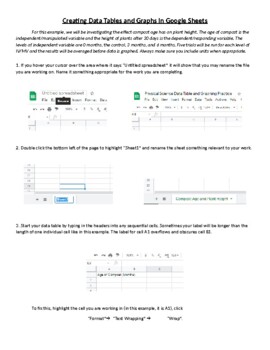
Preview of Creating Data Tables and Graphs in Google Sheets
Creating Data Tables and Graphs in Google Sheets

Created by
Ian Meiser
This is an activity that walks students through the process of organizing and entering data into a data table and then using that data to generate line, bar, and pie charts. Once the graphs are generated, the process of formatting and editing the different parts of each graph is explained.
Preview of 30-60-90School improvement plan(SIP)planning template-editable&fillable resource

30-60-90School improvement plan(SIP)planning template-editable&fillable resource

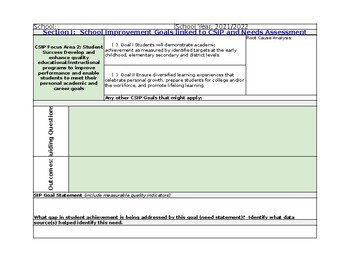
This is an excel sheet with multiple tabs 30-60-90 day plan comprehensive example includes:Section I: School Improvement Goals linked to CSIP and Needs AssessmentSection II:Other Required Information What research did you review to support the use of this strategy and action steps?   What professional learning activities do you need to provide to support the successful implementation of this plan?   What needs to be budgeted for with this plan?How can technolog
Preview of Parabola Transformations - Interactive
Parabola Transformations - Interactive

Created by
PAUL BRECHT
A handy guide to help new students learn how each change affects the shape and direction of parabolas. Clear color coding for the various pieces of the formula and instant updates help separate and isolate the concepts for easy, intuitive learning.Enter information using simple dropdown menus and organized blank fields to isolate each piece of the formula!Two tabs:One allows you to enter individual pieces of information to show the resulting formulaOne allows you to enter the formula to show the
Preview of Staff Information Hub Template(Editable and Fillable resource)

Staff Information Hub Template(Editable and Fillable resource)

Created by
Teach and Lead
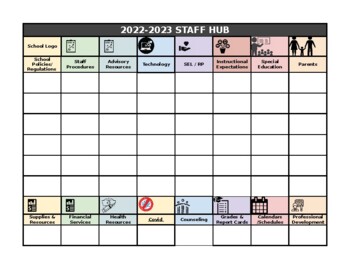
blank STAFF INFORMATION HUB template.Creating a Staff HUB1. Either create a template in excel or in google docs. 2. Change names or icons depending on need.3. Add a document into the spreadsheet by hyperlinking the document. Google Docs:How to hyperlink in a Google Doc Excel:How to hyperlink in excel4. All handbooks were created digitally and hyperlinked into the template. 5. Any document you create can be hyperlinked into the template for easy access.6. I share the HUB at Beginning of Year trai
Preview of Computer Graphing for K & 1st Grade-- Can You Catch the Gingerbread Man?
Computer Graphing for K & 1st Grade-- Can You Catch the Gingerbread Man?

Created by
That Tech Chick
This high interest activity is the perfect thing for the Technology/Computer Lab teacher or the regular classroom teacher to keep their students' attention during the busy holidays. Your kids will sort and count pictures of gingerbread men and record their data as tally marks and/or written numbers. After they finish sorting and counting, they will enter their data into a prepared spreadsheet and generate a super cute pictograph. This activity can be done individually or as a whole group if p
Preview of Weather Tracking in Excel

Weather Tracking in Excel

Created by
TechedOutTeacher
Compatible with Google Sheets, Google Classroom, or as a stand-alone file on a PC, this product is a must have for any teacher comparing weather conditions in multiple locations! BEFORE YOU BUY: This file is part of a larger unit. Save yourself money by purchasing the Super Science Set for Weather and Climate nstead of buying each file separately.   Purchased alone, you get: ⭐ An Excel workbook that enables students to track the weather for 5 different locations as a whole class or individ
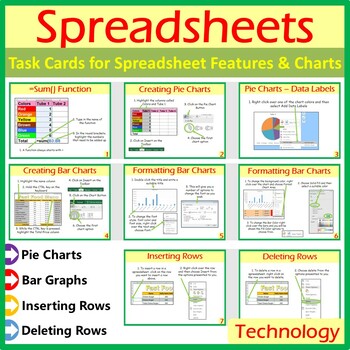
Preview of Microsoft Excel Spreadsheet Features & Chart Task Cards Help Cards
Microsoft Excel Spreadsheet Features & Chart Task Cards Help Cards

A wonderful set of 8 task/instruction cards which can be printed and laminated and then given to students to help them learn and practise the following features in Microsoft Excel:• =sum()• Creating pie charts• Inserting data labels on pie charts• Creating bar charts• Formatting bar charts• Inserting rows in spreadsheets• Deleting rows in spreadsheetsOther Microsoft Excel Products Available:• Microsoft Excel Bundle 1: Click Here• Microsoft Excel Bundle 2: Click Here• Grades 1- 4: Microsoft Excel
Preview of LINE GRAPH MAKER (AUTOMATIC)

LINE GRAPH MAKER (AUTOMATIC)

Created by
Science Girl
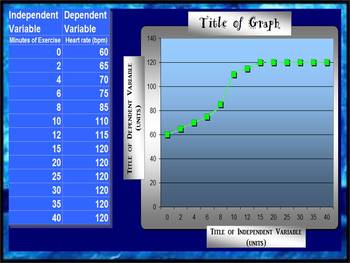
This spreadsheet allows you to insert your independent and dependent variables into a chart and voila!... a line graph is generated as you enter in each piece of new data! Students love to take their data from a lab and watch as a graph is made right before their eyes! You can change all of the titles on the chart and the graph to suit your classes laboratory experiment needs! Students can easily print out their data to include in their lab reports!
Showing 1-24 of 300 results

Discover Summer Teaching Resources | TPT

Uncover more about Summer teaching resources

Teach with Summer Printables from TPT

Summer break is finally here, and while students are excited to kick back and relax, teachers may be searching for fun summer activities to keep their students engaged and learning throughout the summer months in June, July, and August. Luckily, there are plenty of fun and educational resources available that can help keep students motivated and inspired, even when the weather is hot and the sun is shining. In this article, we will explore some of the best summer resources and printables for teachers and students, covering a range of subjects and activities to suit all ages and interests. So, whether you're a teacher looking for new ideas, or a student looking for a fun way to keep learning, read on to discover the best summer resources and printables available.

Ideas for Summer Fun & Learning

  1. Summer Reading Lists and Worksheets

One of the best ways to keep students engaged and learning throughout the summer is to encourage them to read. Reading helps to build vocabulary, comprehension, and critical thinking skills, and can be a fun and relaxing way to spend a lazy summer day. To help promote summer reading, TPT offers a variety of summer reading lists and worksheets for students of all ages. These lists typically include a variety of books in different genres and reading levels, along with discussion questions and activities to help students engage with the material.

  1. STEM Activities and Experiments

For students who love science and technology, there are plenty of STEM activities and experiments available that can be done at home or in the classroom. These activities can help students build skills in areas such as coding, robotics, and engineering, while also encouraging creativity and problem-solving. Some popular STEM activities for summer include building and launching rockets, creating homemade ice cream, and designing and building a solar-powered car.

  1. Art Projects and Crafts

Summer is a great time to get creative, and there are plenty of art projects and crafts that students can do to express themselves and build their skills. From painting and drawing to sewing and pottery, there are endless possibilities for creative expression. Some popular summer art projects include creating a nature journal, making a homemade birdhouse, and designing and creating a summer-themed t-shirt.

  1. Virtual Field Trips

While traditional field trips may not be possible during the summer months, virtual field trips offer a fun and educational alternative. Many museums, zoos, and other attractions offer virtual tours and exhibits that allow students to explore and learn about different topics from the comfort of their own homes. Some popular virtual field trips for summer include exploring the Great Barrier Reef, visiting the Louvre Museum in Paris, and taking a tour of the NASA Space Center.

  1. Summer Worksheets and Printables

For students who prefer more structured learning activities, there are plenty of summer worksheets and printables available that cover a range of subjects and topics. These worksheets can help students build skills in areas such as math, science, and language arts, while also providing a fun and engaging way to learn. Some popular summer worksheets and printables include word searches, crossword puzzles, and coloring pages.

  1. Coloring Pages

Other popular resources to explore are summer coloring pages. Easy to print and sure to keep your kids busy, coloring pages are an excellent way for children to express their creativity, unwind, and improve their fine motor skills. Teachers Pay Teachers offers an extensive selection of summer coloring pages featuring beach scenes, road trips, family outings, and more. These printables are suitable for children of all ages and can be a great addition to your summer routine. Your kids will enjoy spending hours coloring these delightful pages and creating their own masterpieces.

Get Started with Summer Resources from TPT

Summer break is a great time for students to relax and recharge, but it's also important to keep their minds active and engaged. With these top summer resources and printables for teachers and students, you can help keep your students motivated and inspired throughout the summer months. Whether you're promoting summer reading, offering STEM activities and experiments, or providing fun and creative art projects and crafts, there are plenty of ways to keep your students learning and growing all summer long. So, try out some of these fun and educational resources and see how they can make this summer your best one yet!

Frequently asked questions:

Are there free summer activities on TPT?

TPT offers many free summer printables as well as resources available for purchase. This includes individual resources as well as resource bundles. Be sure to explore your options and choose resources that fit your budget and needs.

What is an example of a summer printable on TPT?

There are many different types of summer time activities on TPT that are appropriate for little ones as well as for older kids. This includes resources like: Summer Escape Rooms, book report templates, summer reading logs, summer bingo, math-review packets, and many more. Perfect for sunny or rainy days, these activities will keep your students busy in their free time when they aren't playing with friends in the local pool.

How can I make sure my students stay engaged and motivated during the summer months?

Keeping students engaged and motivated when they are not in school can be a challenge, but there are a few things you can do to help. Encouraging summer reading, offering a variety of fun activities and projects, and providing positive feedback and encouragement can all help to keep students motivated and interested in learning throughout the summer.