49 results
Graphing Common Core 6.SP.B.5 resources $5-10
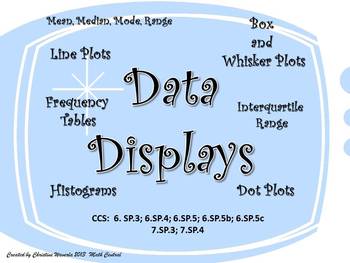
Data Displays: Line Plots, Histograms, Box and Whisker Plots, Frequency Tables
This is one of my favorite teaching tools! I created this Data Display set of worksheets this year for my 6th grade class. My students loved using these worksheets to practice their new skills. Each worksheet provides plenty of room for students to create their data displays and answer questions based on the data. Questions ask students to find the mean, median, mode, range, interquartile range, and percentages.These worksheets are fully aligned with the Common Core Curriculum.CCS: 6.SP.3; 6.SP
Subjects:
Grades:
6th - 8th
Types:
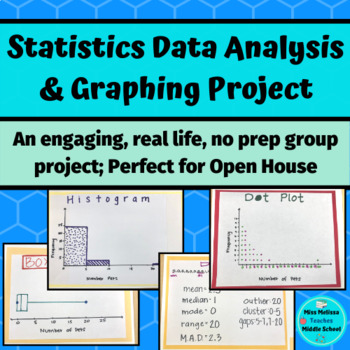
Statistics Project: Data Analysis & Graphing- real life, no prep
This statistics project is intended as a closure for your sixth grade statistics unit and aligns with ALL of the sixth grade statistics and probability common core state standards. In groups, students work together to choose a statistical question to ask the class. Once the class is surveyed, the group works together to create a frequency table, a dot plot, a histogram, and a box and whiskers plot. After creating their graphs, the groups analyze their data by looking at the mean, median, mode ra
Subjects:
Grades:
6th - 7th
Types:
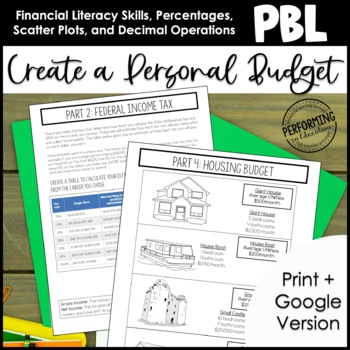
Project Based Learning: Create a Personal Budget 6th Grade Math
Project based learning for 6th grade math skills is awesome! Teach your students math skills and financial literacy through this project-based learning activity. Your students will practice decimal operations (money), work with percentages, and create scatter plots. Challenge activities allow for it to be used in 6th grade as well. It includes a teacher guide walking you through each step.Your students will get their first peek at the process of creating a budget! Kids love having choices, and t
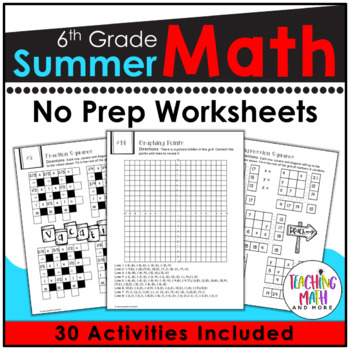
6th Grade Summer Packet | Summer Math Worksheets Grade 6
Need to review math skills? A Summer Math packet that your 6th grade students will want to complete! This packet is FUN and FULL of sixth-grade math problems. Students love the fun coloring, puzzles, and problem solving activities. Save 30% on this resource in the 6th grade math worksheets for the year!How to use it:1. A fun review at the end of 6th grade during May & June or after testing!2. A summer packet for students to complete at home during June, July, & August!3. A beginning of 7
Subjects:
Grades:
6th - 7th
Types:
Also included in: Math Worksheets 6th Grade BUNDLE
Analyzing Plots, Graphs, and Tables using Measures of Central Tendency
This product provides students the opportunity to analyze data presented in different ways. By making calculations and analyzing data, students make conjectures and justify them using mathematical reasoning and evidence!What is included?This product contains 8 student work pages. Each work page contains a set of data displayed graphically with accompanying questions. The data displays included are 2 dot plots, 2 bar graphs, 2 frequency tables, and 2 stem-and-leaf plots. Students are required
Subjects:
Grades:
5th - 11th
Types:
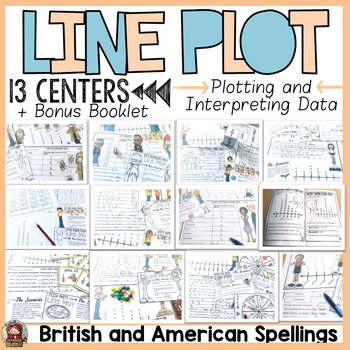
Line Plots With Fractions and Whole Numbers
Interpreting data in Line Plots with fractions and whole numbers feature 13 center interactive activities. Students will work with fractions of a unit and whole numbers to collate and display data using interactive materials like visual cards, dice, spinners, candy, coins, and other real-life data. Items Included13 center Activities (color and blackline): for each center activity students will follow the instructions on a task card to plot data on a line plot and interpret data plotted on a resp
Subjects:
Grades:
3rd - 7th
Types:
6th Grade Daily Math Reviews Weeks 1-5
Help your students keep their math skills sharp with a daily, spiral review. 6th Grade Daily Math Reviews include 25 reproducibles to be used as a daily math warm-up. Each week contains daily reviews (A-D) and a quiz for Friday. Weeks 1-5 review basic computation along with focusing on the Statistics and Probability Common Core math standards including dot plots, histograms, and box plots. Basic computation practice includes long division, multi-digit multiplication, order of operations, fra
Subjects:
Grades:
6th
Types:
Also included in: 6th Grade Math Daily Review Bundle Weeks 1-35
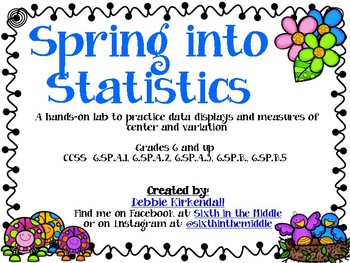
Spring into Statistics Data Displays and Measures of Center Lab
This is a hands-on lab that teaches about Statistical Questions, Data Displays (dot/line plot, histograms, box plots) and Measures of Center (mean, median, mode, and range). The lab includes notes pages, examples with answer keys, and a final project in which the student can survey classmates and create a "flower" by using their data to find mean, median, mode, range. They will also create a box plot, histogram and dot plot.
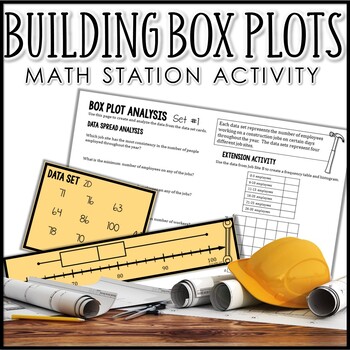
Box Plots Center
This math activity provides your students practice in drawing, interpreting, and analyzing box plots (box-and-whisker diagrams). Students use data sets to create or match a box plot and use it to find measures of center, spread, and interpret the shape of graph. Each of the five data sets included is related to real-world scenarios that might be encountered in a construction job site setting.Students use the data to calculate the interquartile range (IQR), median, minimum, maximum, and range o
Subjects:
Grades:
6th - 7th
Types:
Also included in: 6th Grade Math TEKS Mega Bundle
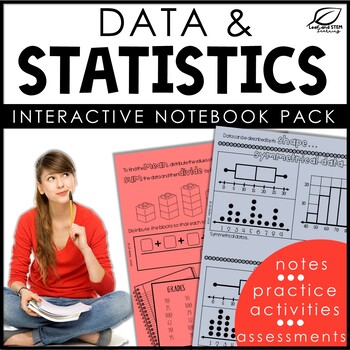
Data and Statistics Notes | Print & Digital
Teach your 6th grade data and statistics unit with this comprehensive set of notes, graphing activities, and data and statistics assessments! This unit is designed to fit neatly in your students' interactive notebooks while also providing easy to copy and use pages that take almost no time to prep.The first part of the unit covers how to create and read data using leaf-and-stem plots, dot plots, histograms, and box plots. Students use pre-made graphs and charts to learn about the important par
Subjects:
Grades:
6th
Also included in: 6th Grade Math TEKS Mega Bundle
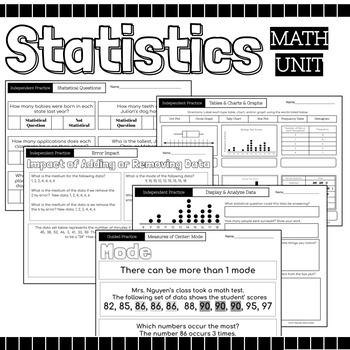
Statistics Math Packet {Data, Charts, Graphs, Mean, Median, Mode, Range, Spread}
52 Page Statics Unit Includes: Guided Instruction & Independent Practice Pages Usage Suggestions and IdeasThis resource can be utilized in numerous ways, here are some ideas:use for guided practiceassign as partner workassign as independent practicecan be used for morning workuse for reteaching in small group settinguse as review prior to assessmentuse as review in continuing to strengthen skillassign for homeworkuse as independent work during math centersTopicsRecognize Statistical Question
Subjects:
Grades:
4th - 12th
Super Bowl Math - 2024 Edition
UPDATED for 2024!New - Bundle includes original Superbowl Math templates and Superbowl Math Cheat Sheets / Quick Version. Also new, Superbowl Timeline template.Target Grade Levels: 4-8 gradeTired of the same old data probability activities involving flipping coins and rolling a number cube?Try using a real-life application using a subject that get students, especially boys, interested in math!Have your students use real-life data/ stats to make a prediction about the Super Bowl winner!Students
Subjects:
Grades:
4th - 8th
Types:
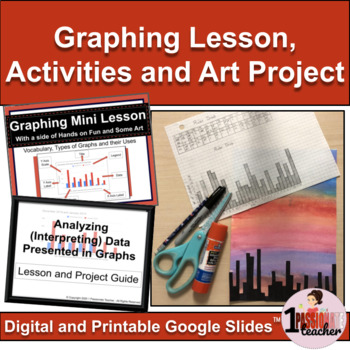
Data Management Ontario | Graphing | Lesson with Activities and Project Bundle
Start your graphing unit off with a bang...or rather a "drop." Begin with the digital mini lesson that reviews data management vocabulary, parts of a graph and different types of graphs. Then give your students some hands-on fun, with a ruler "drop" data collection activity and art project. Now it's deep thinking time! Students will learn about inferring data and creating digital graphs using Google sheets, then will complete a data management and writing process project that will deepen their u
Subjects:
Grades:
5th - 8th
Types:
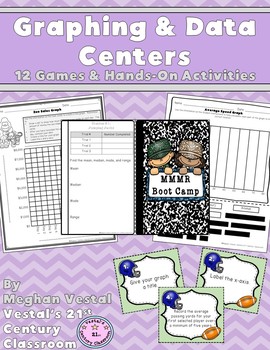
Data and Graphing Centers and Games
Graphing & Data Centers will help students master graphing and data as they play games and complete hands-on activities. Click the "view preview" button at the top of the page to take a closer look at these math centers and games.What is included with these math centers and games?This resource includes a variety of data and graphing centers and games. Included: 8 Hands-On Activities: Hands-on activities teach students about collecting data and creating charts and graphs through movement acti
Subjects:
Grades:
4th - 6th
Types:
Also included in: Math Centers Bundle - Upper Elementary - Entire Year
Graphs and Data Interactive Notebook Lessons {6.SP and 7.SP}
Looking for step by step instructions for interactive notebooking using data and graphs? This file is exactly what you need! There are complete instructions for notebook organization and how students use a self assessment stop light graphic organizer to communicate their comprehension of the lesson. For each lesson, there are complete instructions, student foldables to make the entries completely interactive, and pictures of sample pages. Each lesson also contains data to use with the foldables.
Subjects:
Grades:
4th - 7th
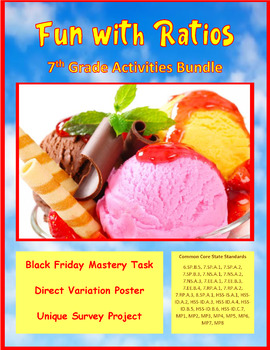
Fun with Ratios Activities Bundle - 7th Grade PBL with Math
The purpose of the Fun with Ratios Activities Bundle is to give students the opportunity to use creativity to apply ratios, proportions, and percentages in real-world settings. This bundle includes three unique tasks: Black Friday Mastery Task, Direct Variation Poster Mastery Task, and the Unique Survey Project. These activities and their accompanying materials are suited for students in grades 7 through 9. These lessons make excellent sub plans. Each project takes approximately two 60-minute bl
Subjects:
Grades:
7th - 9th
Types:
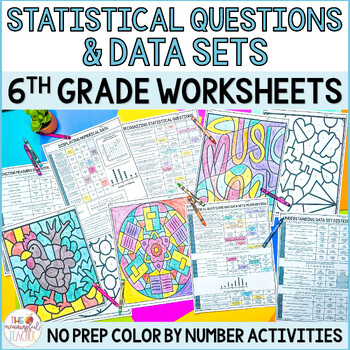
Statistical Questions and Data Sets 6th Grade Worksheets
Are your 6th grade students tired of practicing statistical questions, data sets, and measures of center with boring worksheets? These 6th grade math color by number activities give students meaningful practice working with statistical and non-statistical questions, displaying data, data set distribution, and measures of center, while being creative and coloring!Students will determine statistical and non-statistical questions, understand data set distribution, recognize measures of center, and
Subjects:
Grades:
6th
Types:
Also included in: 6th Grade Math Color by Number Review Worksheets YEAR LONG BUNDLE
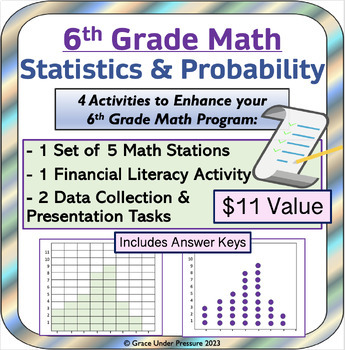
6th Grade Math Statistics: 4 Real World Math Activities for Data & Graphing
Do you need some new, engaging, and applicable math activities for your 6th Grade math unit on Statistics? Here are 4 ready-to-print math products that will get your students thinking in new and creative ways about how the math they learn in class (statistical questions, mean, median, interquartile range, dot plots, histograms) can be helpful in the real world! This bundle includes 20+ pages: - 1 Set of 5 Math Stations: Statistics and Probability: These will get your students working collaborati
Subjects:
Grades:
5th - 7th
Types:
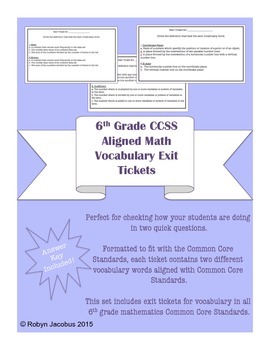
6th Grade Math- Common Core Standard Vocabulary Exit Tickets & Answer Key
6th grade CCSS Math Vocabulary Exit TicketsPerfect for checking how your students are doing in two quick questions. These exit tickets can be printed, or students can complete them using the Easel.Formatted to fit with the Common Core Standards, each ticket contains two different vocabulary words aligned with Common Core Standards.Also included is a master list of all vocabulary words used on the exit tickets, great to use for your classroom word wall!This set includes exit tickets for vocabular
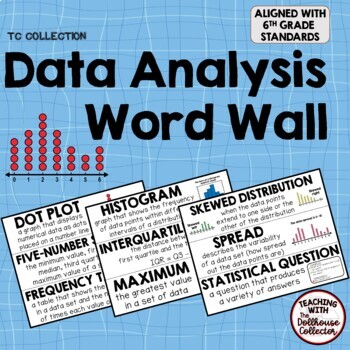
Data Analysis Math Word Wall Cards 6th Grade Statistics Vocabulary Terms
If you are teaching statistics, probability, and data analysis in your 6th grade math class, these data analysis word wall cards are perfect for displaying the math vocabulary in your classroom! Each card shows a vocabulary word, definition/description, and a visual representation. Display them in a pocket chart, enlarge them as posters, or shrink them to fit students' interactive notebooks!This pdf file includes 33 word wall cards for your DATA ANALYSIS word wall. Each card measures approximate
Subjects:
Grades:
5th - 7th

Data and Graphing Math Stations
This math station activity is intended to help students understand how to recognize a statistical question and anticipate the variability in the data set, understand that a set of data collected answer a statistical question, recognize that a measure of center summarizes all of its values with a single number, display numerical data in plots, summarize numerical data sets, and report the number of observations.Please see the PREVIEW above for an idea of everything included!Click HERE to save 30%
Subjects:
Grades:
6th
Types:
Also included in: Math Stations Middle School Bundle
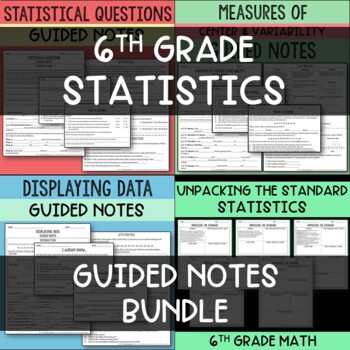
6th Grade Statistics Guided Notes Bundle + BONUS
Looking for guided notes to help you teach your 6th graders Statistics standards? This bundle includes notes for each Statistics standard. Also included is a BONUS "Unpacking the Standard" resource for free!What is included in each resource?Pre-Lesson CheckPost-Lesson CheckGuided NotesIntroduction (Prior Knowledge)PracticeApplicationEditable VersionAnswer Keys*Bonus: Unpacking the Standard Statistics resource*Bonus: Vocabulary Crossword PuzzlePlease look below for the resources included. You can
Subjects:
Grades:
6th

BUNDLE- Performance Task – Graphing & Rational Numbers – Stock Market Savvy
BUNDLE- Performance Task – Graphing & Rational Numbers – Stock Market Savvy
Now you can get more options and save money with this collection of all editions of Stock Market Savvy!
This set includes the Stock Market Savvy Performance Task in 11 different company editions. If you were to purchase each of these Performance Tasks individually, it would cost $44. At only $7, this bundle saves you about 84% off retail price!
In the Stock Market Savvy Performance Task, students analyze the stock
Subjects:
Grades:
6th
Types:
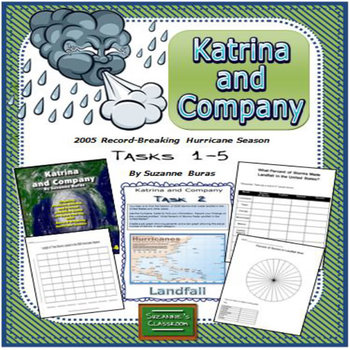
Hurricanes, Fractions to Percents, Statistics, Graphing: Katrina & Co. Tasks 1-5
These statistic tasks related to hurricanes are perfect for math centers, individual or partner work. Katrina and Company, Tasks 1-5, consists of 5 activities dealing with analyzing data related to the 2005 Record-Breaking Hurricane Season of 27 named storms. Students use charts to record information on 4 questions: (1) What percent of storms were in each category? (2) What percent of storms made landfall in the U.S.? (3) What percent of storms lasted the longest? and (4) What percent of storms
Subjects:
Grades:
4th - 7th
Types:
Also included in: Graphing and Analyzing Data: Katrina and Company: Bundle
Showing 1-24 of 49 results


