28 results
7th grade Common Core 4.MD.B.4 worksheets
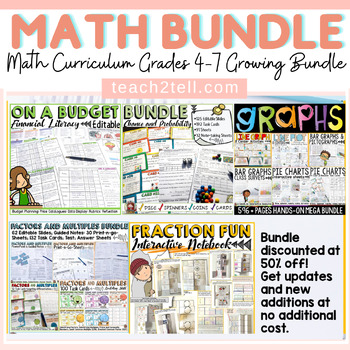
Math Curriculum For 4th Grade, 5th Grade, and 6th Grade Print and Digital
Are you looking for a comprehensive Math Curriculum bundle that includes a variety of resources and activities that cover 4th Grade, 5th Grade, and 6th Level standards?This Math Curriculum Bundle has a range of print and digital resources to teach and reinforce key math concepts aligned to the standards.Best of all, this curriculum bundle is growing, this means more resource topics will be added over time in addition to lots and lots of bonus resources. Save heaps by purchasing at the current p
Subjects:
Grades:
4th - 7th
Types:
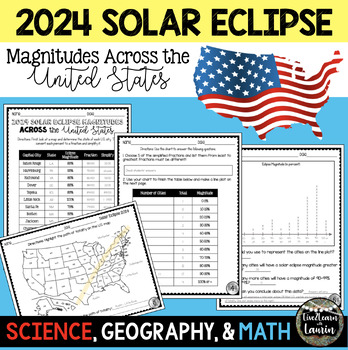
2024 SOLAR ECLIPSE MAGNITUDES ACROSS UNITED STATES - STATE CAPITALS
Are you looking for a fun activity on Solar Eclipse Day that is not busy work? This Solar Eclipse Activity integrates Science, Geography and MATH! Students handle REAL and RAW DATA about the magnitudes (for the April 8, 2024) for each state capital across the United States all while ... converting percents to fractionssimplifying fractionsordering fractionsmaking line plotsanalyzing datausing mapsreviewing state abbreviationsThis is geared towards 4th grade Math standards, but would make great p
Subjects:
Grades:
4th - 8th
Types:
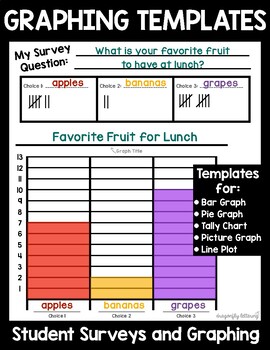
Graphs & Survey Templates - Conduct a Survey, Create Graphs, Analyze Data
Graphing and Survey TemplatesAligns with K-5 CCSS for Measurement and DataThese worksheets can be used YEAR ROUND! Students love giving surveys and gathering information from their classmates. Graphing and analyzing data is an important skill that develops across grade levels.This file includes:2 Introductory Bar Graph Surveys4 Bar Graph TemplatesA blank template to use for Line Plots, Picture Graphs, Bar Graphs, etc.4 Tally Graph Templates1 Pie Chart TemplateGraphing QuestionsEach graphing temp
Grades:
K - 8th
Types:
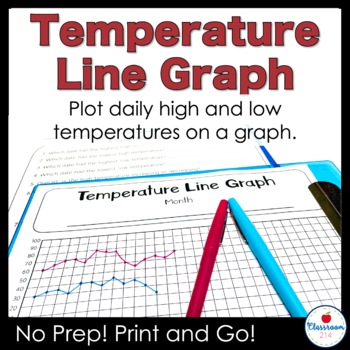
Weather Temperature Graph with Data Analysis Questions
Graph daily high and low temperatures on a line graph. At the end of the month, use the data analysis questions to promote critical thinking about temperature trends and practice graph reading skills. A perfect a weather unit, bell ringer or morning work assignment to sharpen math, earth science, and data analysis skills. WHAT'S INCLUDEDFahrenheit graph (-20 - 100 degrees Fahrenheit)Celsius graph (-20 - 40 degrees Celsius)Seven data analysis questions to be completed at the end of the monthAD
Subjects:
Grades:
2nd - 8th
Types:
NGSS:
3-ESS2-1
, MS-ESS2-5
Math Intervention Workbooks BUNDLE K-8th
Math Intervention Workbooks MEGA BUNDLE K-8th. Struggling math learners' workbooks to use for extra help on specific CCSS-aligned math topics. This bundle of math intervention workbooks is a supplemental resource for students in general education, special education, or resource rooms. Workbooks included: 8th-grade books 1-3, 7th-grade books 1-3, 6th-grade books 1-3, 5th-grade books 1-3, 4th-grade books 1-3, 3rd-grade books 1-3, 2nd-grade books 1-3, 1st-grade books 1-3, and Kindergarten books 1-3
Subjects:
Grades:
K - 8th
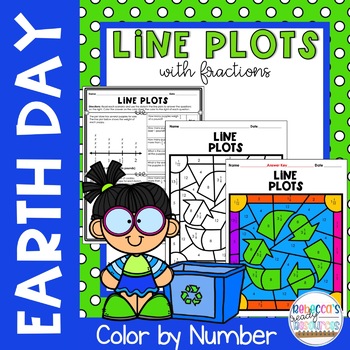
Earth Day Line Plots with Fractions Color by Number
This line plots with fractions color by number features a fun, engaging Earth Day theme. This resource is awesome for giving your students extra practice with line plots and includes fractions. This color by number activity aligns with: CCSS:5.MD.B.2: Make a line plot to display a data set of measurements in fractions of a unit (1/2, 1/4, 1/8). Use operations on fractions for this grade to solve problems involving information presented in line plots. CCSS:4.MD.B.4: Make a line plot to display a
Subjects:
Grades:
4th - 7th
Types:
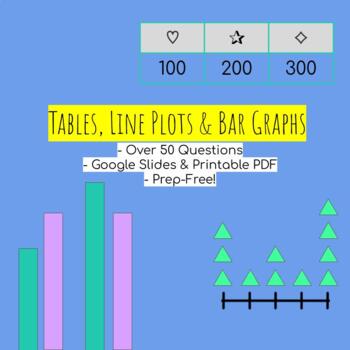
Tables, Line Plots & Bar Graphs - Google Slides & Printable PDF! Dozens of ?s
Common Core Aligned! Many of these questions model past NYS Regents exams for grades 4 & 5. (A little tricky for 4th, I used as enrichment only)THE PRODUCT:1. Google Slides - 20 questions! 10 multiple choice, 10 short answer.2. Printable PDF with 4 pages of questions. +30 questions. (I used the PDF as four separate worksheets for practice & hw)3. Answer keys included for both!MATH GOALS:Focus:- Interpreting line plots- Interpreting & completing tables- Interpreting bar graphsSkills R
Subjects:
Grades:
4th - 7th
Types:
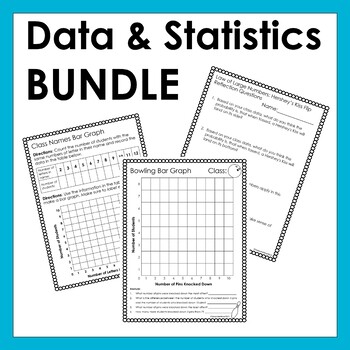
BUNDLE:Graphing, Probability, Data Collecting Activities/Stations Middle School
7-Activity/Station Data Day This download includes seven different data and statistics activities. These activities promote math group discussions, team work, and creativity in mathematics and great for students who are visual and hands on learners. Activity #1: Name Bar GraphsTeach your students about bar graphs by creating a class wide bar graph using your student’s names. This download provides directions as well as student work pages to graph the names of their classmates. Needed Materials
Subjects:
Grades:
5th - 8th
Types:
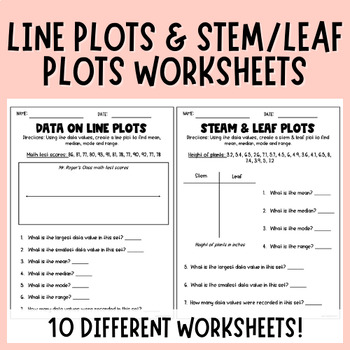
Stem and Leaf and Line Plots| Data | Mean | Median | Mode | Range | Worksheets
Looking for resources to review line plots, steam and leaf plots, and finding mean, median, mode and range with your students? Look no further! These NO PREP worksheets are a great way to review analyzing data sets! These set comes with 10 different worksheets. These worksheets can be used as a review, teaching tool, or test prep!This Resources Contains: 5 worksheets on line plots5 worksheets on stem & leaf plotsThese worksheets would be great for differentiated small groups, independent cen
Subjects:
Grades:
3rd - 7th
Types:
Line Plots Activity - Printable & Digital Chile Adventure Worksheet
This resource is a play on the Adventure books of your childhood with line plots. An Adventure assignment allows students choice of which problems they practice. After each problem they receive a clue about the mystery country they are exploring. By the end, hopefully they will have enough pieces of the puzzle to guess where in the heck they are. Student choices will affect the types of clues they will receive and allows for additional practice for enrichment or remediation. In my experience, ou
Subjects:
Grades:
4th - 7th
Types:
Also included in: Adventure - PRE-ALGEBRA BUNDLE - Printable & Digital Activities
Online Math Test Prep for RIT Band 211 - 220 Set A
This set of digital math worksheets provides students the opportunity to practice problems based on the skills outlined in NWEA's Learning Continuum for MAP 6+ Test. These practice problems are designed to provide students with a vast exposure to the 211 – 220 RIT Band skills and concepts that they are ready to develop. This resource can be used for differentiated instruction, math workshops, and progress monitoring. This set contains 16 digital, self-graded worksheets using Google Forms. There
Subjects:
Grades:
4th - 8th
Types:
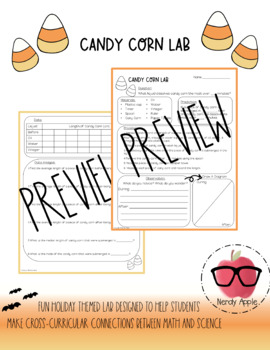
Candy Corn Lab
This worksheet includes all the steps to complete the Candy Corn Lab. You just need supplies! This lab is designed to help students make cross-curricular connections between math and science. There is a large amount of data analysis including finding the average, mode, and median as well as graphing the data. For this experiment, I allowed each student to have their own cup and gave them a specific liquid so that we could get several measurements of candy corn.You can also decide how long you wa
Subjects:
Grades:
4th - 7th
Types:
NGSS:
5-PS1-3
, 5-PS1-4
Online Math Test Prep for RIT Band 221 - 230 Set A
This set of digital math worksheets provides students the opportunity to practice problems based on the skills outlined in NWEA's Learning Continuum for MAP 6+ Test. These practice problems are designed to provide students with a vast exposure to the 221 – 230 RIT Band skills and concepts that they are ready to develop. This resource can be used for differentiated instruction, math workshops, and progress monitoring. This set contains 16 digital, self-graded worksheets using Google Forms. There
Subjects:
Grades:
4th - 8th
Types:
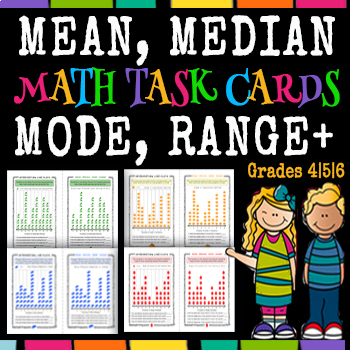
Mean, Median, Mode, and Range | Math Task Cards 50% SALE!
Hello! Do you need an amazing Mean, Median, Mode and Range Mega Bundle? Are you seeking fun, relevant and meaningful graph worksheets that engage students? This is a great 2-in-1 math resource! The resource combines Mean, Median, Mode, Range questions using fun Line Plot Graphs for learners to enthusiastically measure data using whole numbers. The resource includes editable student worksheets that is great for Distance Learning! REVIEW! "This product is a great value for practicing mean, med
Subjects:
Grades:
4th - 7th
Types:
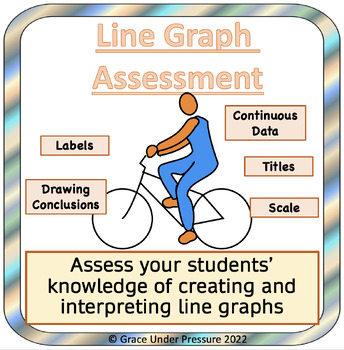
Line Graph Assessment: scale, labels, interpreting, continuous vs. discrete data
This activity uses data from a realistic scenario (a bike ride) to assess students’ graphing and interpreting skills when working with line graphs.Assesses if students can:- determine a reasonable scale- create and properly label a line graph- explain how data was collected- differentiate between discrete and continuous data- interpret a line graph- draw reasonable conclusions from a set of data- identify information between data pointsAn answer key included for easy marking out 20 points!This p
Subjects:
Grades:
4th - 8th
Types:

Frank Stockton’s “The Lady or The Tiger” – 18 Common Core Learning Tasks!!
This Common Core resource includes 18 rigorous unit learning tasks for Frank Stockton’s short story, "The Lady or The Tiger.” The teacher-created learning tasks include standard(s) alignment using the language of Common Core State Standards. The unit activities represent a balance of analysis and evaluation activities focusing on a variety of literary elements, constructed responses, and extended informational/explanatory and argumentative writing. This resource also includes some embedded exter
Subjects:
Grades:
6th - 10th
Types:
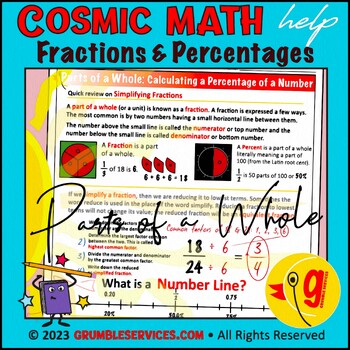
Parts of a Whole: Simplifying Fractions Review, Converting Fractions to Percents
Parts of a Whole: Simplifying Fractions Review, Converting Fractions to Percents • VETERAN Elementary Montessori-inspired Mental Math help (4 printable pages + key):What are parts of a whole and how are they related to fractions and percentages? These pages guide young mathematicians to:Review highest common factors and simplifying fractionsReintroduce number lines for fractions and percentagesPractice calculating a fractions of whole integers Practice calculating percentages of a whole integers
Subjects:
Grades:
5th - 7th
Types:
Probability, Patterns, Graphs, and Equations Mini-unit BUNDLE
Probability and Patterns Worksheets and Study Guide including determining the likelihood of an event, representing probability as a number, creating models or practical problems to represent probability, and patterns found in objects, pictures, numbers, and tables. Correlated with 2016 VA SOL 4.13 and 4.15 and CCSS 4.OA.C.5 and 7.SPC.5. The calculator symbol indicates that the problems in this unit will appear on the section of the Grade 4 Virginia SOL Math test that allows a calculator. I
Subjects:
Grades:
3rd - 7th
FREE Online Math Diagnostic Assessment for RIT Band 211 - 220
This is a sampler of 20 problems from Online Math Test Prep for RIT Band 211 - 220 Set A, which is a set of digital math worksheets provides students the opportunity to practice problems based on the skills outlined in NWEA's Learning Continuum for MAP 6+ Test. This diagnostic assessment is designed to provide teachers with data before students take NWEA's MAP 6+ Math Assessment. This sampler contains 20 problems using Google Forms. There are five problems that address each of the following math
Subjects:
Grades:
4th - 8th
Types:
Math Masters Nifty Fifty Math Review
strong>Math Masters Nifty Fifty Math ReviewMath Masters Nifty Fifty is a set of 50 Math Review Pages with six intense problems per page for students to solve to become Math Masters. The problems cover basic math knowledge that students need to continually practice to stay sharp. Each Math Master is followed by the answer key. The pages cover 8 Mathematical Practices. check your state standards specifically for your grade level. Includes: computation, measurement, algebra, geometry, problem so
Subjects:
Grades:
4th - 7th
Types:
Also included in: Math BASICS BUNDLE

Halloween Line Plot Activity
This activity is a fun way to get in the Halloween spirit while reviewing data collection, line plots, as well as pictographs. I used this in our line plot lesson and included a pictograph on the back to reinforce our previous lesson on pictographs. There are also follow up questions on the back side.
Subjects:
Grades:
2nd - 7th
Types:
Mystery Island - Mapping and Location Task
An engaging and hands on approach to teaching students about elements of maps and location.This task supports students in the following concepts:- Grid coordinates- Compass points- Creating a scale- Creating a key- Creating directions- Geometric reasoningThis resource includes:* a printable template with grid paper* a template to write their directions * a task card with a checklist of instructionsEnjoy!
Subjects:
Grades:
2nd - 7th
Types:
STEM-ersion - Line Plots Printable & Digital Activity - Fitness Instructor
STEM-ersion assignments aim to immerse students in an authentic application within a STEM career. This STEM-ersion focuses on line plots. Students often ask what careers will use certain math skills and I think this is an opportunity to show them where the thinking is used! These problems aim to help students construct responses with my Evidence - Analysis - Conclusion framework that I use in all of my classes. These questions are carefully crafted not to have one correct answer, but to require
Subjects:
Grades:
5th - 7th
Types:
Also included in: STEMersion - PRE-ALGEBRA BUNDLE - Printable & Digital Activities
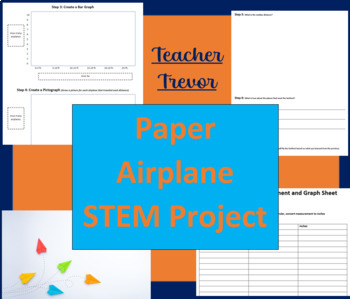
Paper Airplanes STEM Project
This S.T.E.A.M. assignment integrates measurement (using a ruler and converting feet to inches), data (finding median and creating both a pictograph and a bar graph), and engineering (creating paper airplanes and learning from experimentation).Materials needed- 2 pieces of paper per student- 1 Ruler per student or group- A long, flat area that is free of obstacles (used to fly paper airplanes)- 1 copy of the “Paper Airplanes Measurement and Graph” worksheet pages per student Instructions1. In s
Subjects:
Grades:
3rd - 8th
Types:
Also included in: STEM Bundle
Showing 1-24 of 28 results


