TPT
Total:
$0.00

Earth Day Algebra Patterns and Graphing 5th Grade Math Color by Number Bundle

Rated 4.79 out of 5, based on 19 reviews
4.8 (19 ratings)
;
Rebecca's Ready Resources
2.1k Followers
Grade Levels
4th - 6th
Standards
Formats Included
  • Zip
Pages
48 pages
$3.00
List Price:
$6.00
You Save:
$3.00
Bundle
$3.00
List Price:
$6.00
You Save:
$3.00
Bundle
Share this resource
Report this resource to TPT
Rebecca's Ready Resources
2.1k Followers

Products in this Bundle (6)

    showing 1-5 of 6 products

    Description

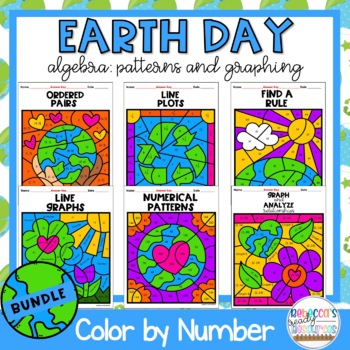
    This Earth Day Math Color by Number Bundle is perfect for your students to practice algebra: patterns and graphing!

    Save $$$$$. Buy the bundle! This color by number math bundle contains six products with an Earth Day theme. Each product is perfect for math centers, early finishers, homework, independent work, or review.

    The activities in this bundle align with:

    5.G.A.1

    5.G.A.2

    4.MD.B.4

    5.MD.B.2

    5.OA.B.3

    Skills covered:

    • Ordered Pairs
    • Line Plots with Fractions
    • Line Graphs
    • Numerical Patterns
    • Find a Rule Input/Output Tables
    • Graph and Analyze Relationships

    No prep! Just print the black & white versions of the worksheet and the color sheet for your students.

    Each product in the bundle contains:

    -an Earth Day-themed color by number math puzzle color sheet

    -a worksheet with problems

    -two answer keys (one for the color sheet and one for the worksheet)

    *Follow my store by clicking on the green star above! More color by number products are to come. By following my store, you will be notified by email when I upload a new product.

    *Remember to leave feedback! You can earn TpT credits to save money when you buy future products.

    *Click on the "Pin it" button at the top of this page to share on Pinterest! If you like this product, others may like it too.

    Thanks,

    Rebecca

    Total Pages
    48 pages
    Answer Key
    Included
    Teaching Duration
    45 minutes
    Last updated Apr 25th, 2020
    Report this resource to TPT
    Reported resources will be reviewed by our team. Report this resource to let us know if this resource violates TPT’s content guidelines.

    Standards

    to see state-specific standards (only available in the US).
    Make a line plot to display a data set of measurements in fractions of a unit (1/2, 1/4, 1/8). Solve problems involving addition and subtraction of fractions by using information presented in line plots. For example, from a line plot find and interpret the difference in length between the longest and shortest specimens in an insect collection.
    Make a line plot to display a data set of measurements in fractions of a unit (1/2, 1/4, 1/8). Use operations on fractions for this grade to solve problems involving information presented in line plots. For example, given different measurements of liquid in identical beakers, find the amount of liquid each beaker would contain if the total amount in all the beakers were redistributed equally.
    Generate two numerical patterns using two given rules. Identify apparent relationships between corresponding terms. Form ordered pairs consisting of corresponding terms from the two patterns, and graph the ordered pairs on a coordinate plane. For example, given the rule “Add 3” and the starting number 0, and given the rule “Add 6” and the starting number 0, generate terms in the resulting sequences, and observe that the terms in one sequence are twice the corresponding terms in the other sequence. Explain informally why this is so.
    Use a pair of perpendicular number lines, called axes, to define a coordinate system, with the intersection of the lines (the origin) arranged to coincide with the 0 on each line and a given point in the plane located by using an ordered pair of numbers, called its coordinates. Understand that the first number indicates how far to travel from the origin in the direction of one axis, and the second number indicates how far to travel in the direction of the second axis, with the convention that the names of the two axes and the coordinates correspond (e.g., 𝘹-axis and 𝘹-coordinate, 𝘺-axis and 𝘺-coordinate).
    Represent real world and mathematical problems by graphing points in the first quadrant of the coordinate plane, and interpret coordinate values of points in the context of the situation.

    Reviews

    Questions & Answers