TPT
Total:
$0.00

2024 SOLAR ECLIPSE MAGNITUDES ACROSS UNITED STATES - STATE CAPITALS

Rated 5 out of 5, based on 2 reviews
5.0 (2 ratings)
;
Live2Learn with Laurin
1.8k Followers
Grade Levels
4th - 8th, Homeschool
Standards
Formats Included
  • PDF
Pages
All Capitals (5 pages) and Condensed (3 pages)
$3.00
$3.00
Share this resource
Report this resource to TPT
Live2Learn with Laurin
1.8k Followers

Description

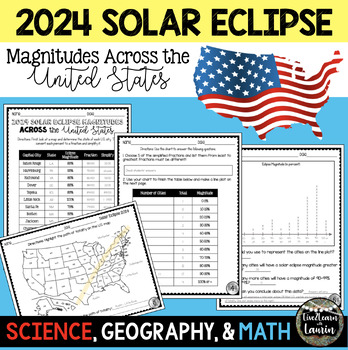
Are you looking for a fun activity on Solar Eclipse Day that is not busy work? This Solar Eclipse Activity integrates Science, Geography and MATH!

Students handle REAL and RAW DATA about the magnitudes (for the April 8, 2024) for each state capital across the United States all while ...

  • converting percents to fractions
  • simplifying fractions
  • ordering fractions
  • making line plots
  • analyzing data
  • using maps
  • reviewing state abbreviations

This is geared towards 4th grade Math standards, but would make great practice or review for higher grades!

Two Versions Included:

  • All 50 State Capitals (May take two or more classes periods)- 6 pages
  • Condensed (12 State Capitals) (should take one class period)- 3 pages

*Please see pictures/previews.

What do the students do?

- Write the state abbreviation for each capital

- Convert the percents (magnitude) to a fraction

- Simplify fractions to lowest terms

- Create a line plot using the percent data

-Analyze date to answer questions!

I created a similar activity for the August 2017 solar eclipse. See reviews for that HERE!

"My students were really engaged in this lesson, and it was very east to follow."

-TPT customer

Thanks for stopping by!

:) Laurin

Total Pages
All Capitals (5 pages) and Condensed (3 pages)
Answer Key
Included
Teaching Duration
N/A
Last updated 4 months ago
Report this resource to TPT
Reported resources will be reviewed by our team. Report this resource to let us know if this resource violates TPT’s content guidelines.

Standards

to see state-specific standards (only available in the US).
Make a line plot to display a data set of measurements in fractions of a unit (1/2, 1/4, 1/8). Solve problems involving addition and subtraction of fractions by using information presented in line plots. For example, from a line plot find and interpret the difference in length between the longest and shortest specimens in an insect collection.
Explain why a fraction 𝘢/𝘣 is equivalent to a fraction (𝘯 × 𝘢)/(𝘯 × 𝘣) by using visual fraction models, with attention to how the number and size of the parts differ even though the two fractions themselves are the same size. Use this principle to recognize and generate equivalent fractions.

Reviews

Questions & Answers

1.8k Followers