510 results
High school graphing worksheets for Microsoft Word
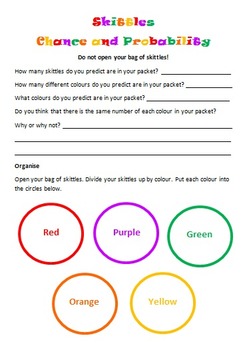
Skittles Chance and Probability (Editable)
Chance and Probability activity using yummy Skittles!!!
Students are to predict the colours and quantities before they open the skittles bag. Students are to complete a chance experiment where they use a tally to collect their data. Students then transfer their data in fractions, decimals and percentages. Students are to create a bar graph using their data as well as answer chance and probability questions about the data. I used this with my grade 5/6 students and they loved it!
Subjects:
Grades:
3rd - 10th
Types:
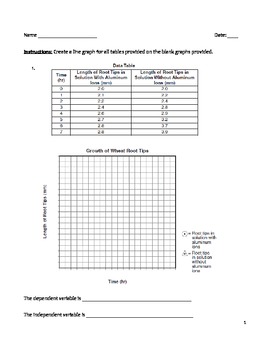
High School Science Graphing Worksheet - Making Line Graphs in Science
Use this worksheet to help your students practice making line graphs. In addition, they will have to identify both the independent and dependent variables. Hopefully, they will make the connection between the variables and their placement on the graph. There is a key provided for the teacher. There are ten line graphs for students to work with.
line graph, plot points, independent variable, dependent variable, data table, uniform scale, x-axis, y-axis
Subjects:
Grades:
8th - 12th
Types:
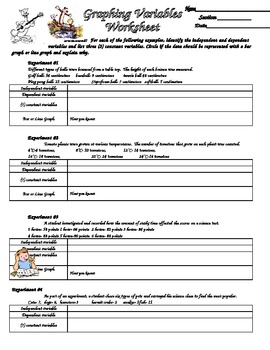
Scientific Method Variables and Graphing Practice
Students are given six different sets of experimental data and asked to identify the variables (independent, dependent etc.). They also reinforce graphing by identifying if the data should be represented with a bar or line graph. With this information, students the create data tables and graphs for the data.
Subjects:
Grades:
3rd - 12th
Types:
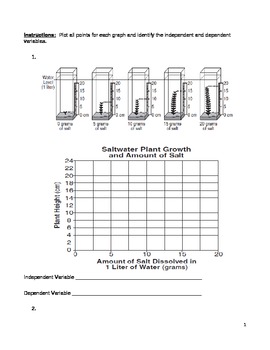
Middle School Math and Science Graphing Practice - Middle School Line Graphs
Use this resource to help your middle school math and science students learn and practice how to make line graphs as well as identify the independent and dependent variables. Move beyond bar graphs! There is a teacher key provided and eight graphs for practice.
line graph, plot points, x-axis, y-axis, independent variable, dependent variable
Subjects:
Grades:
5th - 9th
Types:
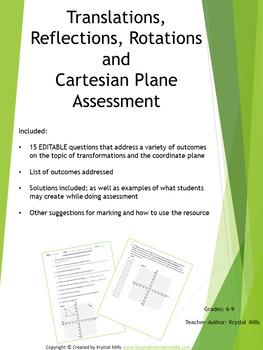
Translation, Reflection, Rotation and Cartesian Plane Test
This Translation, Reflection, Rotation, and Cartesian Plane Test can be used as a quiz, test, assignment, or formative assessment to assess your students' understanding of the Cartesian plane and Transformations. How you use this editable document (WORD file) will depend on your grade level, outcomes, learning goals, and students. Various outcomes are addressed including:-label the x and y axes and origin of a Cartesian plane-identify points on a Cartesian plane -plot points on a Cartesian plane
Subjects:
Grades:
6th - 9th
Types:
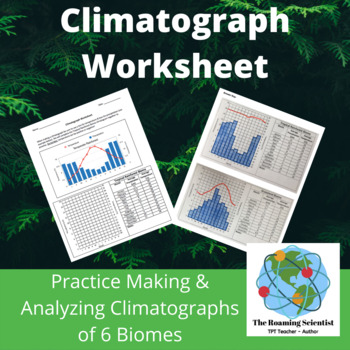
Printable Climatograph Worksheet
This comparative biome graphing worksheet asks students to create and analyze six climatographs for six of Earth’s major terrestrial biomes. Help your students develop graphing skills including drawing bar graphs, line graphs, dual y-axis graphs and interpreting data.This climatograph activity can be used as a lesson, homework assignment, it can be used in small groups or individually or as a revision activity. This is also an excellent substitute teacher lesson. This activity is easily modifiab
Subjects:
Grades:
6th - 12th
Types:
Making Science Charts and Graphs
A simplified look at making charts and organizing data in science.
-Data Charts
-Circle Graphs
-Bar Graphs
-Line Graphs
-Key Vocabulary List
-Quiz/Assessment
-Activity - Practice
-Teacher answer key for quiz and activity
Thanks for taking the time to stop by my store!
Mrs. Degs
Teaching Science Well
Blog: http://teachingsciencewell.wordpress.com/
Facebook: https://www.facebook.com/TeachingScienceWell
TPT: http://www.teacherspayteachers.com/Store/Teaching-Science-Well-Science-Resources
Pi
Subjects:
Grades:
3rd - 10th
Terminal Speed Physics Lab & Graphing Activity using Coffee Filters {EDITABLE}
Do you want a teach your students about terminal speed, but can't find the time to put together a complex lab and then mark it all?
This is the lab for you!
This is part of my cost-saving, amazing Physics Bundle!
This is a quick lab that your students can complete start to finish in one class period. The student handout pages include:
• Purpose
• Question
• Rationale
• Materials
• Procedure
• Observation Table
• Graphing and Follow-up Questions + Conclusion
You'll need:
• meter stick
• coff
Grades:
7th - 12th
Types:
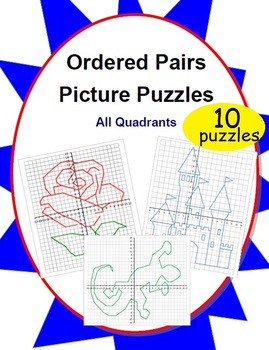
10 Ordered Pairs Mystery Picture Puzzles (All Quadrants)
10 original pictures perfect for any order pair puzzler. Start simple with a continuous connect-the-dot picture and graduate to more complex pictures composed of multiple sections. The built-in self-checking nature of creating a picture makes it easy for students to immediately assess their own progress.This 15-page PDF file includes:- 10 reproduction-ready original picture puzzles- An illustrated key so teachers can select appropriate puzzles based on student skill level and intended use- Numbe
Grades:
4th - 10th
Types:
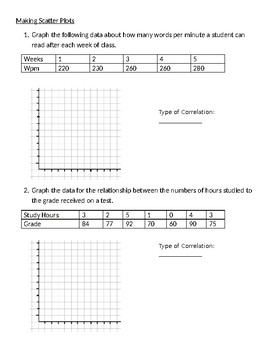
Making Scatter Plots Worksheet
2 pages of practice problems with given information to create scatter plots
Grades:
5th - 12th
Types:
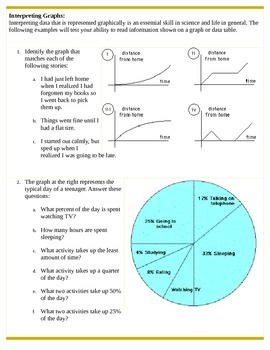
Interpreting Graphs Review Worksheet
This worksheet allows you test student's ability to read and interpret data presented on various types of graphs and data tables. Students must be able to read scientific notation to complete this worksheet.
The worksheet may be given as an assessment. It may also be split into several smaller warm-up activities and given over several days.
Subjects:
Grades:
9th - 12th
Types:
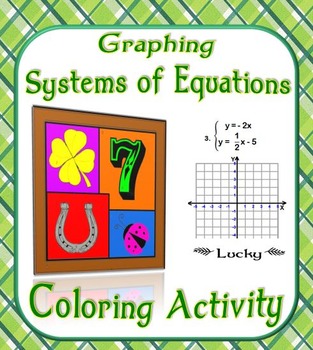
Graphing Systems of Equations Coloring Activity
This is a set of 9 systems problems that asks students to graph in both standard and slope-intercept form to find x and y. The set contains large coordinate graphs to help students graph more accurately. Students solve the problem, find the answer in the picture, and color it based upon a given table of colors.
Graphing Systems of Equations Coloring Activity by Suzie's Angle is licensed under a Creative Commons Attribution-NonCommercial-NoDerivatives 4.0 International License
Grades:
8th - 11th
Types:
CCSS:
ACT ASPIRE - Test Prep - Practice - Reading Graphs/Data Interpretation Exemplar
Students will read a short passage and use different types of tables and graphs to answer questions. A great resource for AMI day. Distance Learning. Keywords- ACT, ACT ASPIRE, SCIENCE, GRAPHS, ACT Aspire like questions, Test Prep
Subjects:
Grades:
3rd - 9th
Types:
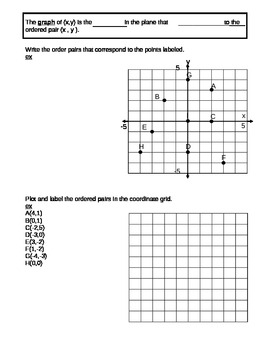
Coordinate Plane
This is a document that is used for guided notes for the Coordinate Plane. The notes practices how to plot points given ordered pairs, how to write the ordered pairs given the graph,and numbering the 4 quadrants.
Grades:
5th - 10th
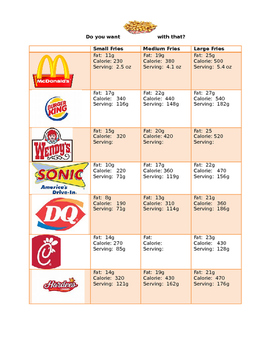
French Fry Scatter Plot & Best Line of Fit
Students will compare the nutritional values and serving sizes of french fries from various fast food restaurants. Based on this information, they will create scatter plots, best lines of fit and the equation of the trend line. Using the equation, they will estimate the unknown values of kid meals and supersized portions of french fries.
Subjects:
Grades:
8th - 11th
Types:
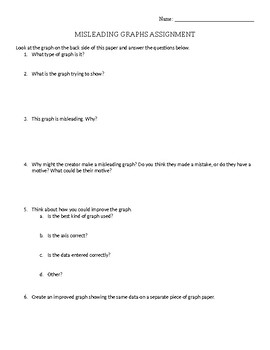
Misleading graphs assignment
A package of 15 misleading graphs. Students answer a few questions about the graphs and make an improved graph. Students can do one or more graphs. The following website is a great source for students to learn about misleading graphs prior to the activity: https://venngage.com/blog/misleading-graphs/
Grades:
7th - 12th
Types:
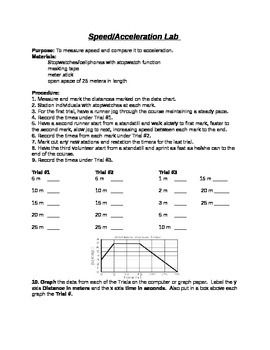
Speed/Acceleration Lab: Physical Science Activity to Measure and Graph Motion
This is an activity that involves the students in measuring, collecting data, calculations and graphing. This is done as a class with 8 timers, 3 volunteers to walk/run and a recorder. Volunteers are timed moving down the hallway and the time and distance data is used to create graphs showing constant speed/velocity and acceleration. Students have to calculate average speed and answer questions on how to identify the differences in movement on the graphs.
Subjects:
Grades:
7th - 10th
Types:
NGSS:
HS-PS2-1

Christmas Science Lab Dissolving Candy Cane Experiment
STEM Your students will be very interested in this activity. It has become a holiday tradition that my students look forward to experiencingStudents in this laboratory activity work cooperatively to produce the desired product, make observations, and examine the effect of heat on bonding forces. They complete a written handout relating to the effect of heat on bonding and have lots of fun.The product contains 2 labs. At the conclusion, students will answer questions and complete a graph. Detai
Grades:
7th - 10th
Types:
NGSS:
MS-PS1-4
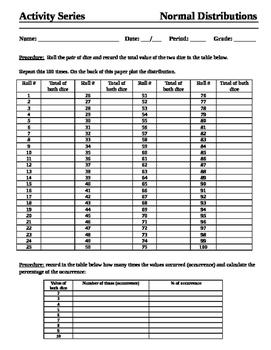
Normal Distributions - Activity Series
This activity sheet helps students better understand normal distributions through the use of dice. Each student rolls a pair of dice and adds the total of each dice and records it 100 times. Then they plot the distribution and in most cases it comes out a bell curve. Its a fun and easy way to show the distribution. You could pair students up for less dice usage.
Subjects:
Grades:
10th - 12th
Types:
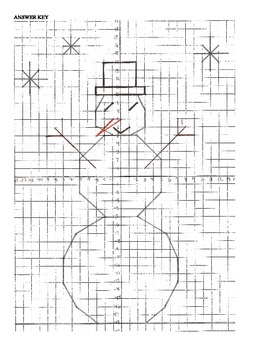
Frosty the Snowman Graphing Activity!
Students will graph equations that are written in slope-intercept form given a restricted domain or range to find out, "Who comes alive with a magic hat each year?"
You may have the students add color to the lines once the graphing is complete to make Frosty the Snowman look more real! There are 7 parts they must graph, including the three main body parts, the hat, the face, arms, and three snowflakes.
The answer key is attached. Fun activity for the holidays or review for a snowy winter day. Gr
Grades:
8th - 11th
Types:
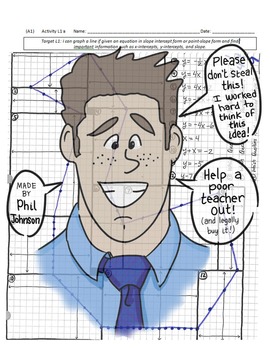
Slope Intercept Form Activity
Objective: This is an activity to help students understand graphing lines in Slope-Intercept Form. Each side of the activity has a variety of lines that, when graphed correctly, create a hidden picture! The first side will create a swan, while the back is a little more advanced and will create a fish! Students enjoy trying to figure out what type of picture is hidden behind all the math; this is a great puzzle activity and a great “thinker!”
Grades:
7th - 10th
Types:
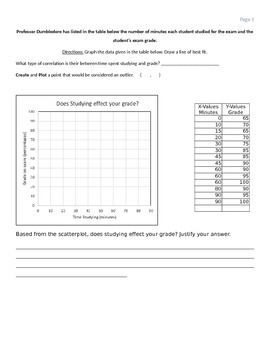
Scatter plot worksheet (Positive Correlation)
In this worksheet, the students are given a scenario and table of data points. The students must plot the points, draw a line of best fit, create & plot a possible outlier data point. Also, there is a short writing portion where students must reflect and write about the scatter plot scenario.
Subjects:
Grades:
6th - 9th
Types:
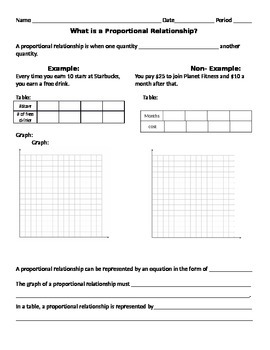
Graphing Proportional Relationships
This is a notes page I used to work through an example and non-example situation that can be represented in a table and a graph. The students had to decide whether or not it was a proportional relationship based on the table and the graph. The students seemed to enjoy it and found it very helpful in their understanding! Would be great for a short review or for a quick introduction!
Subjects:
Grades:
6th - 9th
CCSS:
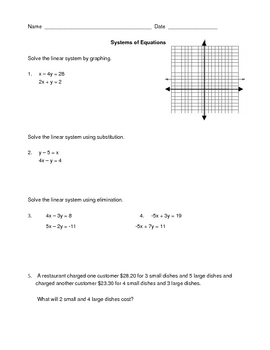
Solving Systems of Equations Three Ways
Here is a one page, 5 problem worksheet/quiz to give students to check their understanding of solving systems of equations using graphing, substitution, and elmination including a real world application word problem. Answer key is included.
Grades:
7th - 10th
Types:
Showing 1-24 of 510 results


