42 results
10th grade Common Core 8.SP.A.4 worksheets
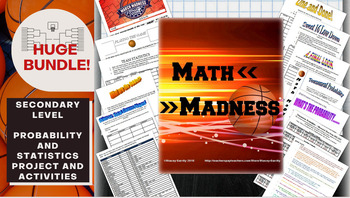
Math March Madness Full Tournament Project {BUNDLE}
Harness the excitement of NCAA March Madness with this huge project for secondary math teachers that follows all stages of the tournament! This Common Core aligned bundle comes with bonus parts not sold individually in my store so you can create a rich immersion in the tournament, practice probability and statistics and learn some interesting new ones along the way! Save $3 plus get bonus content by bundling!You can pick and choose which parts you would like to incorporate, or follow my schedu
Subjects:
Grades:
6th - 12th, Higher Education
Types:
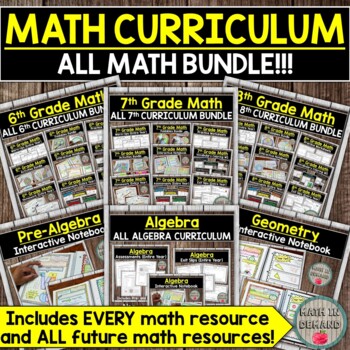
Entire Math Curriculum Bundle (All Math Resources)
⭐ This bundle includes ALL of my Math Curriculum in my Teachers Pay Teachers store ⭐You will be receiving ALL of my 6th, 7th, and 8th Grade Math interactive notebooks, activities, foldables, practice worksheets, warm-ups, exit slips, assessments, and much more! This is well over 1000 pages of material that I have created to help make math more enjoyable to students. My material also helps students to make connections to the real world.In addition to all of the math material in my store, you will
Subjects:
Grades:
5th - 10th
Types:
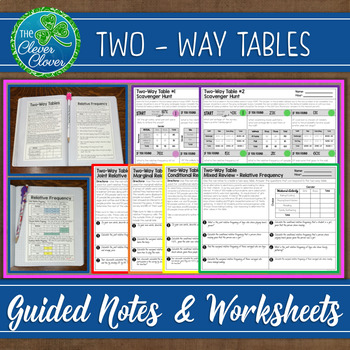
Two - Way Tables - Notes and Worksheets
This two-way table resource includes guided notes, practice worksheets and two scavenger hunts. Your students will have the opportunity to create, interpret and discuss two-way tables. Below, you will find a detailed description of the notes, worksheets and scavenger hunts.
Guided Notes
There are three half pages of guided notes on two-way tables. The first page of notes provides the definition of a two-way table. Next, students can use step by step directions on how to create a two-way table.
Subjects:
Grades:
7th - 10th
CCSS:
Also included in: Statistics Bundle - Guided Notes, Worksheets & Scavenger Hunts!
Two Way Tables - Application Activity
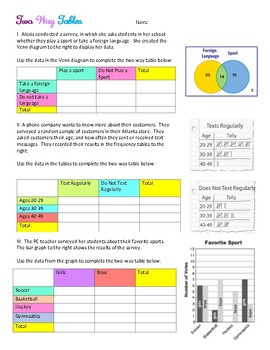
This resource allows students to apply what they have learned about two-way tables. Students will be given venn diagrams, tally tables and double bar graphs and will create two way tables from that set of data.
Subjects:
Grades:
7th - 10th
Types:
CCSS:
8th Grade Open Up Resources All Unit Summative Practice - Editable
Howdy,Are you using Open Up Resources 8th Grade Units authored by Illustrative Mathematics®? Here is the bundle of all 8 units Summative Practice Problems. There are 127 pages and 287 problems.You will get great data and information about which of your students need more help with specific 8th grade content. I have created the images, diagrams, and graphs saving you lots of time. These are formatted for easy and quick scoring. Print and Go! The answer key is included.Note: This product is based
Subjects:
Grades:
8th - 10th
Types:
Linear Relationships (Regression): 30+ Scatter Plot Worksheets
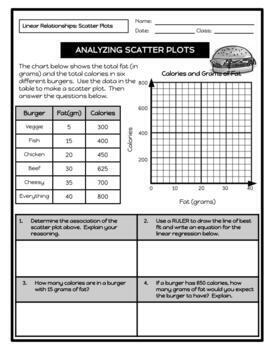
Practice using scatter plots with 30+ activities covering the following topics:Quantitative versus Qualitative DataUnivariate Data versus Bivariate DataCausation versus Non-CausationReading a Scatter PlotDetermining Line of Best FitConstructing Scatter PlotsAnalyzing Scatter PlotsDetermining Correlation CoefficientCreating Residual PlotsIndependent InvestigationThese activities can be used as general practice, bell ringers, exit tickets, homework, and/or benchmarks. Students are required to gra
Subjects:
Grades:
8th - 12th
Types:
CCSS:
Energy Drinks and Sodas Statistics Bundle
Use statistics about energy drinks and sodas (sugar and caffeine content) to practice finding measures of central tendency and variability and creating charts such as box-and-whisker plots, dot plots, and histograms. The students will compare the amount of sugar and caffeine in energy drinks and sodas.The following topics are covered:Mean, Median, & ModeFive-number summaryIQR & RangeBox plots (with or without checking for outliers)Mean absolute deviationStandard deviationHistogramDot Plo
Subjects:
Grades:
6th - 12th
Types:
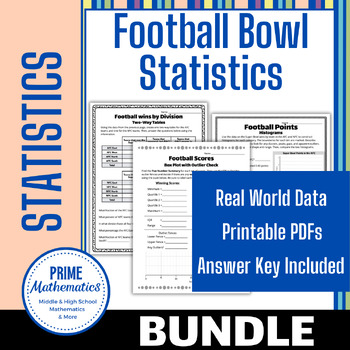
Football Bowl Statistics Super Bundle
Use statistics from previous football championships to practice finding measures of central tendency and variability and creating charts such as box-and-whisker plots, dot plots, and histograms. The students will look at football championship wins and scores. This is a super way to engage sports fans in math.The following topics are covered:Mean, Median, & ModeFive-number summaryIQR & RangeBox plots (with or without checking for outliers)Mean absolute deviationStandard deviationHistogram
Subjects:
Grades:
6th - 12th
Types:
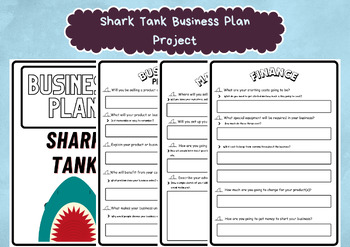
Shark Tank Business Plan Project - Business Strategy Roleplay Game for Kids
Here is what you get:7 pages of Shark Tank Business Plan Project, a fun activity to teach kids about business planning. It can also be a roleplay game where the teacher can be the judge and let students present their projects.All of the products of WorksheetGuardian has been prepared by İrem Kurt, who is the creator of this store.PLEASE NOTE:This is a DIGITAL FILE INSTANT DOWNLOAD only,printable in an array of standard frames sizes.No physical product will be shipped.After checkout you will be d
Grades:
4th - 12th, Higher Education, Adult Education, Staff
Types:
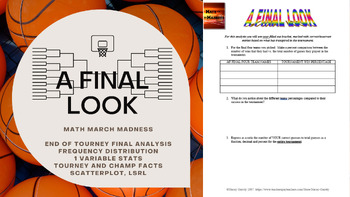
Math March Madness - A Final Look (Freq Distributions, Stats, Regression Lines)
Fill out a bracket, watch the tournament unfold and then mathematically analyze how you did! This activity is flexible enough to be used for a variety of levels. I have used all 6 pages for an AP Statistics class, and have used pages 1 through 5 for an Algebra or Algebra 2 class. You could even use it in lower levels as long as you are covering percents, and basic stats like mean, median, mode and graphing. The document is editable so you can adjust/delete to tailor to the level of statistic
Subjects:
Grades:
4th - 12th, Higher Education
Types:
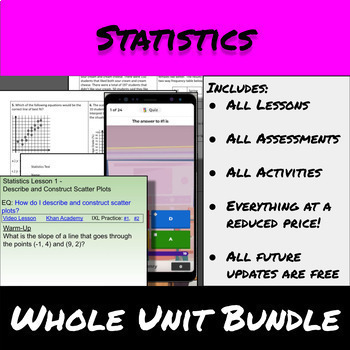
Statistics-Whole Unit Bundle
This bundle includes EVERYTHING needed to teach the unit on Statistics with scatter plots and two-way frequency tables for 8th grade students.Included are:all lessons(with video lesson, homework, and worked out solutions)all worksheets free and paidall activitiesall assessmentsYou get all unit resources at 20% off. Purchase now and you also get any future updates and new resources free without having to purchase them as all new resources will be added to the bundle.Free Updates:12/1/2023: Added
Subjects:
Grades:
7th - 10th
Types:
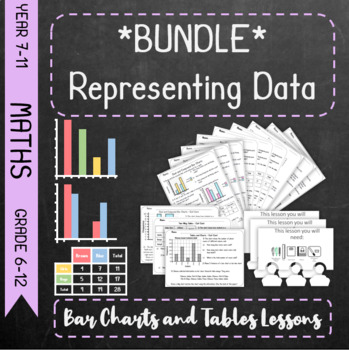
*Bundle* Representing Data - Bar Charts and Tables *Bundle*
This is a bundle featuring the following individual resources:Charts & TablesTwo-Way TablesDual and Compound Bar ChartsThese lessons are based around the scheme of work laid out by the Pearson Key Stage 3 Maths Progress DeltaCharts & Tables - Lesson on Frequency and Tally Tables and Bar ChartsTwo-Way Tables - Lesson on Two-Way TablesDual and Compound Bar Charts - Lesson on Dual/Comparative and Compound/Composite Bar Charts
Grades:
5th - 12th
CCSS:
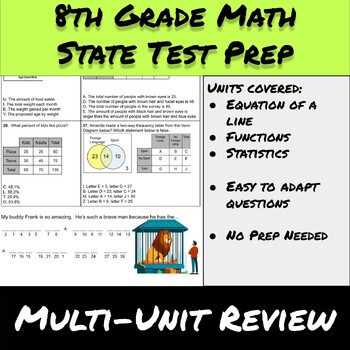
State Test-Multi-Unit Review-Equation of a Line, Functions, Statistics
This self-correcting activity will allow students to review their knowledge of writing the equation of a line, all things functions, and statistics. This review covers many of the most important standards for 8th grade math.In 27 questions students students will practice the following skills:Find slopes and y-intercepts from tables and graphsWrite the equation of a line given: two points, a table, a graphDetermine if a relation is a function or notFind rates of change and initial values for fun
Subjects:
Grades:
7th - 10th
Types:
Also included in: 8th Grade Math-Algebra and Pre-Algebra Whole Course Growing Bundle
Scatter Plots Worksheet Complete Lesson Pack (NO PREP, KEYS, SUB PLAN)
Scatter Plots Worksheet - Complete Lesson with No PrepHere’s a Complete Lesson Pack on how to solve Scatter Plots.This Complete Lesson Pack includes the following PDF Files:Lesson PlanPowerPoint PresentationGuided NotesPractice Worksheet (Version A)Practice Worksheet (Version B)Master Quiz*All PDF Files come with Answer Keys for easy grading and teachingIt also includes the following Links:Link to YouTube video that goes with this LessonLink to Online Interactive Quiz that goes with this LessonL
Grades:
6th - 10th
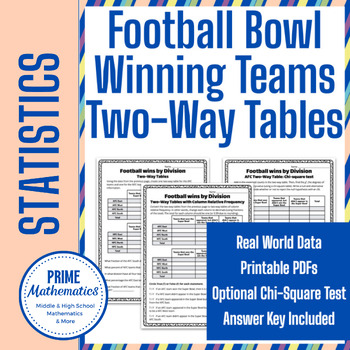
Two-Way Tables of Football Bowl Winners by Division
Use statistics about teams that have appeared in or won the Football Bowl to practice creating and interpreting two-way tables. Teams are categorized by division and whether they have appeared in or won the national pro football championship. Also, chi-square tests are included for higher-level statistics courses like AP Stats.The following topics are covered:Creating Two-Way TablesCreating Two-Way Tables of relative frequency (optional)Interpreting Two-Way TablesChi-square test for homogeneity
Subjects:
Grades:
8th - 12th
Types:
CCSS:
Also included in: Football Bowl Statistics Super Bundle
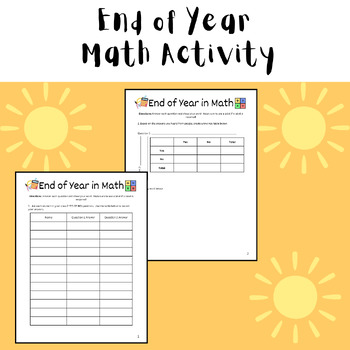
End of Year Math Activity - Printable Resource on Categorical Data
This NO PREP printable resource for middle school math students, can also be used for elementary age students (with scaffolding) or high school students in Algebra, Pre-Algebra, or Algebra 2.These activities includes the following math skills:Data AnalysisBivariate Categorical Data Tables If you are looking for more middle school math activities, try these!Middle School Math Activities - In Our Middle School EraMiddle School Math End of Year Activity - Measurement
Subjects:
Grades:
3rd - 10th
Types:
CCSS:

Bivariate Data Worksheet Bundle
Are you working on a unit covering bivariate data? This bundle is a GREAT addition, helping students master creating and describing scatter plots with numerical and categorical data!** SAVE 20% when you purchase the Complete Pack or SAVE 50% when you purchase the Year-Long Bundle**21 Student Pages; 21 Teacher PagesPossible uses:- Guided Notes- End-of-topic cumulative review guide- Extra practice for struggling students- Homework- Test prep- Bellringer or warm ups********************************
Subjects:
Grades:
7th - 10th
Types:

Statistics-Hidden Message-Two-Way Frequency Tables
Let your students practice creating two-way frequency tables and answering questions from them. They will answer each question and fill in the blanks at the bottom of the page revealing the punchline to the joke.Questions too hard or too easy? This is provided as a Google Doc and it set up so all questions are easy to adapt for the needs of your students.Included are 2 versions of the worksheet: an easier and a harder versionThe easier version has 14 questions and the harder version has 23 ques
Grades:
7th - 10th
Types:
CCSS:
Also included in: 8th Grade Math-Algebra and Pre-Algebra Whole Course Growing Bundle
Line of Best Fit Worksheet Complete Lesson Pack (NO PREP, KEYS, SUB PLAN)
Line of Best Fit Worksheet - Complete Lesson with No PrepHere’s a Complete Lesson Pack on how to solve Line of Best Fit.This Complete Lesson Pack includes the following PDF Files:Lesson PlanPowerPoint PresentationGuided NotesPractice Worksheet (Version A)Practice Worksheet (Version B)Master Quiz*All PDF Files come with Answer Keys for easy grading and teachingIt also includes the following Links:Link to YouTube video that goes with this LessonLink to Online Interactive Quiz that goes with this L
Grades:
6th - 10th
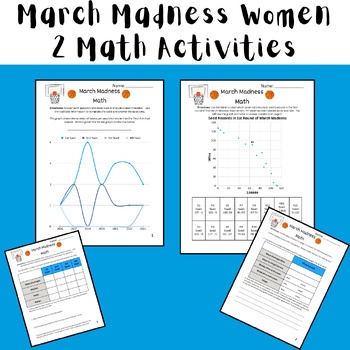
March Madness Math - Women's Basketball Data Analysis Printable/Digital 2024
These 2 activities are fun NO PREP math activities to do to celebrate March Madness! The activities can be completed as 2 separate activities, stations, or as a multi-page packet. There is a fully customizable digital resource (Canva Template) and a printable resource (Canva) that contain the same directions and activity for each resource. This was designed for students in middle school, but could be used for upper elementary and high school students in Pre Algebra, Pre-Algebra, or Algebra.In th
Subjects:
Grades:
4th - 10th
Types:
8th Grade Statistics and Probability Standards 8.SP.A.1 - 8.SP.A.4 - MEGA BUNDLE
Four Bundles in one - covering all four 8th Grade Statistics and Probability Standards.Learning Station Resource Packs for the following Standards:8.SP.A.1 - Construct and Interpret Scatter Plots8.SP.A.2 - Approximate a Line of Best Fit on a Scatter Plot8.SP.A.3 - Write and Interpret an Equation for the Line of Best Fit8.SP.A.4 - Two Way TablesEach of the four resource packs contains all the resources you need to create three learning stations for that skill (12 learning stations in all!)Designe
Grades:
8th - 10th
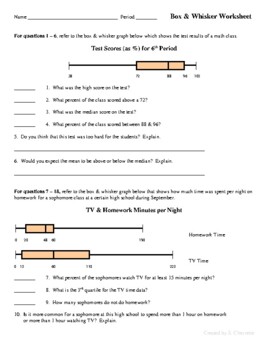
Box and Whisker Plot Worksheet
This is an original notes sheet/graphic organizer I created. Make copies for your students and then project the document on your board. Lead the lesson, filling in blanks, supplementing my notes, and doing examples. Have students complete some examples independently.
Subjects:
Grades:
7th - 12th
CCSS:
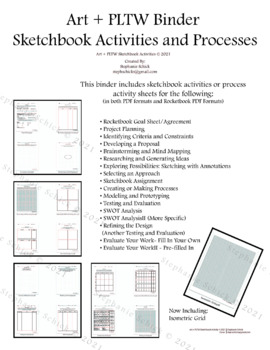
PLTW, Science and Art Processes and Activities Binder
Art + PLTW + Science BinderSketchbook Activities and ProcessesThis binder includes (in both PDF formats and Rocketbook PDF Formats) sketchbook activities or process activity sheets for the following:• Rocketbook Goal Sheet/Agreement• Project Planning• Identifying Criteria and Constraints• Developing a Proposal• Brainstorming and Mind Mapping• Researching and Generating Ideas• Exploring Possibilities: Sketching with Annotations• Selecting an Approach• Sketchbook Assignment• Creating or Making Pro
Grades:
6th - 12th, Higher Education, Adult Education
Types:
NGSS:
MS-ESS3-2
, MS-ETS1-2
, MS-ESS3-1
, HS-ETS1-2
, HS-ETS1-3
...
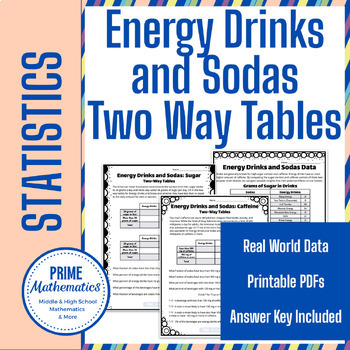
Two Way Tables of Energy Drinks and Sodas
Use statistics about energy drinks and sodas (sugar and caffeine content) to practice creating and interpreting two-way tables. Also, an optional addition on relative frequency two-way tables and chi-square tests for homogeneity are included. The students will compare energy drinks to sodas regarding their sugar and caffeine.The following topics are covered:Creating Two-Way TablesCreating Two-Way Tables of relative frequency (optional)Interpreting Two-Way TablesChi-square test for homogeneity (o
Subjects:
Grades:
8th - 12th
Types:
CCSS:
Also included in: Energy Drinks and Sodas Statistics Bundle
Showing 1-24 of 42 results

![Preview of Year 10 Biology (Australian Curriculum) [Workbook]](https://ecdn.teacherspayteachers.com/thumbitem/Year-10-Biology-Australian-Curriculum-Workbook--6442923-1646016135/large-6442923-1.jpg)
