17 results
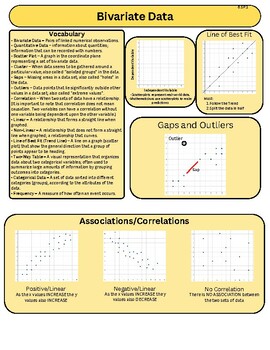
10th grade Common Core 8.SP.A.4 handouts
Sponsored
Daily Algebra Warm-Ups with Weekly Quiz Quarter 2
Increase retention in Algebra with daily warm-ups that incorporate spiral review. Day 1-4: 5-7 minute warm-up. Day 5: Quiz that covers topics reviewed that week. Practice Makes Permanent!
Subjects:
Grades:
8th - 10th
Types:
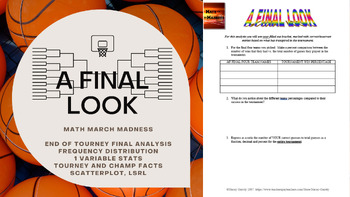
Math March Madness - A Final Look (Freq Distributions, Stats, Regression Lines)
Fill out a bracket, watch the tournament unfold and then mathematically analyze how you did! This activity is flexible enough to be used for a variety of levels. I have used all 6 pages for an AP Statistics class, and have used pages 1 through 5 for an Algebra or Algebra 2 class. You could even use it in lower levels as long as you are covering percents, and basic stats like mean, median, mode and graphing. The document is editable so you can adjust/delete to tailor to the level of statistic
Subjects:
Grades:
4th - 12th, Higher Education
Types:
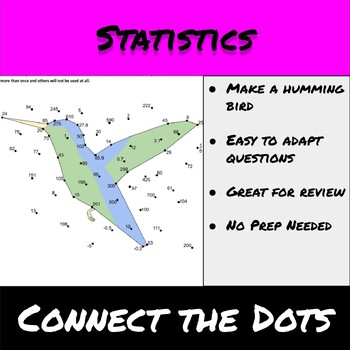
Statistics-Connect the Dots-Scatter Plot and Two-Way Table Review
This connect the dots activity will keep your kids guessing what the shape is until the very end. Mine love to make while guesses while working. The final picture will be a humming bird.Questions too Hard or too Easy? This is provided as a Google Doc and it set up so all questions are easy to adapt for the needs of your students.Students will practice the following skills:Identify the correlation in a scatter plotFind features of scatter plots like gaps, clusters an outliersWrite the equation f
Grades:
7th - 10th
Types:
Also included in: 8th Grade Math-Algebra and Pre-Algebra Whole Course Growing Bundle

Statistics-Hidden Message-Two-Way Frequency Tables
Let your students practice creating two-way frequency tables and answering questions from them. They will answer each question and fill in the blanks at the bottom of the page revealing the punchline to the joke.Questions too hard or too easy? This is provided as a Google Doc and it set up so all questions are easy to adapt for the needs of your students.Included are 2 versions of the worksheet: an easier and a harder versionThe easier version has 14 questions and the harder version has 23 ques
Grades:
7th - 10th
Types:
CCSS:
Also included in: 8th Grade Math-Algebra and Pre-Algebra Whole Course Growing Bundle
Statistics Investigation for Algebra 1
This project was developed to let the students model mathematics. The students become a detective and determine if a hand, foot, or femur is the best measure of height. This file is the worksheets that go along with the power point. The students need knowledge of linear regression and causation vs. correlation, and residuals. This generally takes at least 2 days in the classroom.
Subjects:
Grades:
8th - 12th
Types:
CCSS:
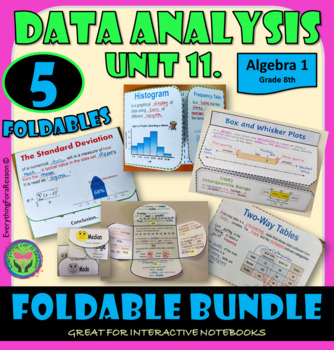
Unit 11. Data Analysis and Displays INB, Digital and PDF
This bundle contains 4 interactive foldables or graphic organizers. Your students will love these fun and colorful notes. They are a great addition to your INB! get all of them with a 30% discount from the regular price!What is included?- Mean, median, mode, and range foldable- Box and whisker plots foldable- Histograms and frequency tables- Standard deviation foldable- Two way tables foldableCheck the rest of this collection for Algebra 1 Foldables Bundle:Unit 1. PRE-ALGEBRA REVIEW FoldablesBun
Subjects:
Grades:
8th - 10th
CCSS:
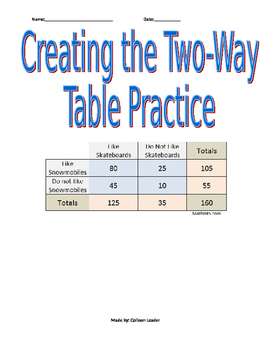
Organizing Two-Way Table Practice
This activity provides students a chance to practice two-way tables and analyze bivariate data. The students are required to make the two-way table from given data and then analyze the relative frequencies.
Subjects:
Grades:
8th - 11th
Types:
CCSS:
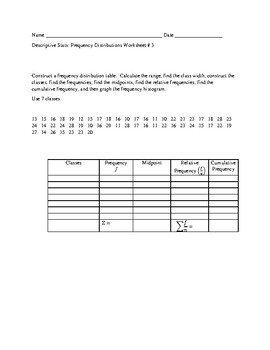
Frequency Distribution Worksheet #3 with Answer Key
This worksheet contains one problem that asks students to complete a frequency distribution table, including constructing the classes, finding the class width, calculating the midpoints, finding the relative and cumulative frequencies, and then draw a frequency histogram for the data.You may also be interested in:Frequency Distribution Worksheet #1Frequency Distribution Worksheet #1 with Answer KeyFrequency Distribution Worksheet #2Frequency Distribution Worksheet #2 with Answer Key
Subjects:
Grades:
9th - 12th, Higher Education
Types:
CCSS:
Data Foldable and Bulletin Board Trim
Directions:Bulletin Board: Print the completed terms and use for a classroom bulletin board. Cut each page into 2 terms for maximum coverage on your bulletin board.Foldable: Print the incomplete terms and hand to students. Students cut along dashed line, stack and staple along the edge. Students can then define and provide examples taken from class or at home review.Targeted Purpose or Skills:1. Engaging learning environment2. Terminology introductionTargeted Topics1. Data
Subjects:
Grades:
9th - 12th, Higher Education, Adult Education
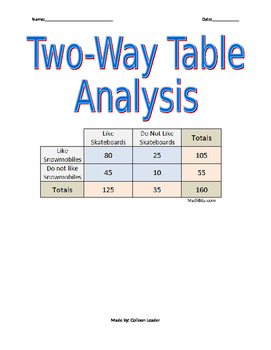
Two-way table Analysis
This activity is good practice for students to work on analyzing and creating two-way tables. Students also have to calculate relative frequencies from the two-way tables.
Subjects:
Grades:
8th - 11th
Types:
CCSS:
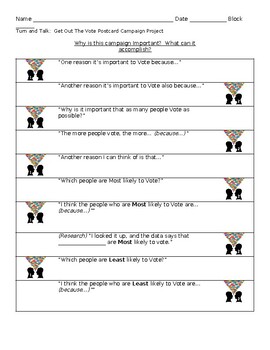
GOTV Postcard Campaign Project - Turn and Talk Handout (to turn in)
Turn-and-Talk Handout for GOTV Project:I use my "Forced Turn-and-Talk" format (in my TPT shop!).It's fully structured and prepared for you, and included in this product.This Handout and the greater GOTV Project PowerPoint slides direct students through this exercise. Of course, you can use this Handout alone.Students are guided through a Forced Turn-and-Talk to answer these Questions: Q: “Why is it important to Vote?” Q: “Why is it important that as many people Vote as possible?”Q: “Why is it i
Subjects:
Grades:
6th - 12th, Higher Education, Adult Education, Staff
Types:
Also included in: GOTV Get Out The Vote Postcard Campaign Project! Full Bundle!
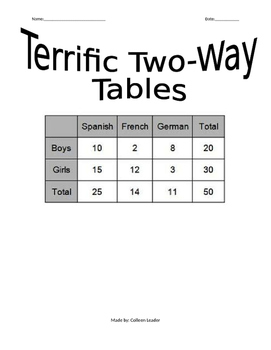
Two-way tables Practice
This activity provides students with a chance to practice creating two-way tables as well as analyze the results of given two-way tables.
Subjects:
Grades:
8th - 11th
Types:
CCSS:

Analyzing Two-Way Tables
This activity is good practice for students to work on two-way tables. The students need to calculate and analyze relative frequencies based on a set of data in two-way tables.
Subjects:
Grades:
8th - 11th
Types:
CCSS:

Two-way table Practice
This activity provides students two different scenarios to create a two-way table and analyze the results and relative frequencies.
Subjects:
Grades:
8th - 11th
Types:
CCSS:
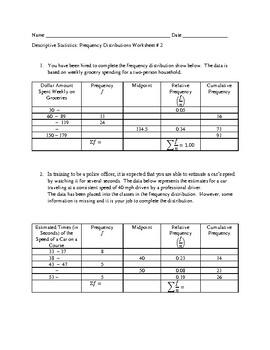
Frequency Distribution Worksheet #2 with Answer Key
This worksheet provides two, partially filled in frequency distributions. Students need to fill in the missing values based on their knowledge of classes, class widths, frequencies, relative frequencies, midpoints, and cumulative frequencies.You may also be interested in:Frequency Distribution Worksheet #1Frequency Distribution Worksheet #1 with Answer KeyFrequency Distribution Worksheet #3Frequency Distribution Worksheet #3 with Answer Key
Subjects:
Grades:
9th - 12th, Higher Education
Types:
CCSS:

Expected Value Activity Involving Cereal Boxes Common Core
Students analyze a classic cereal box toy problem. The students are presented with a scenario about a collection of six toys in a cereal boxes and how long it would take to get each toy. Students simulate the experience by conducting an experiment in class.
Subjects:
Grades:
7th - 12th
CCSS:
Showing 1-17 of 17 results

