TPT
Total:
$0.00

Graph Task Card Bundle with Bar Graphs, Pictographs, Line Plots

Rated 4.94 out of 5, based on 60 reviews
4.9 (60 ratings)
;
The Tulip Teacher
5.4k Followers
Grade Levels
2nd - 4th
Standards
Formats Included
  • Zip
Pages
73 pages
$8.00
List Price:
$10.00
You Save:
$2.00
Bundle
$8.00
List Price:
$10.00
You Save:
$2.00
Bundle
Share this resource
Report this resource to TPT
The Tulip Teacher
5.4k Followers

What educators are saying

These are perfect for our hands on station. With so many cards we were able to do the activity for 2 days. The kids loved it!
These are very well made, however the numbers on the cards are a little too hard for them to add right now in the school year when we reach this standard. We haven't gotten into the double digits in addition yet in the curriculum and that was a little challenging for them.

Products in this Bundle (4)

    Description

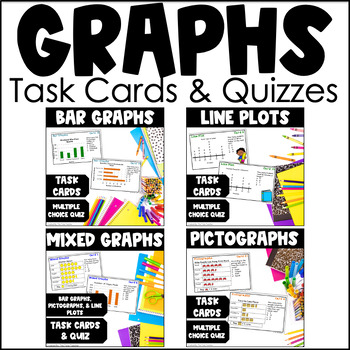
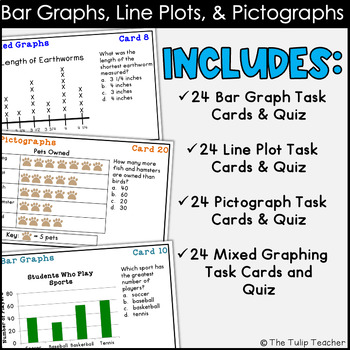
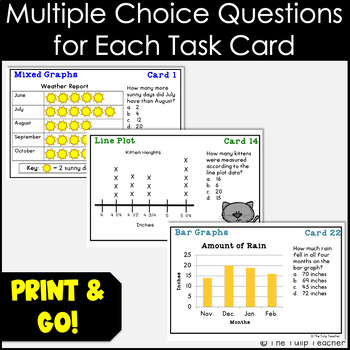
    Looking for a set of task cards covering bar graphs, line plots, and pictographs? This graphing bundle includes a total of 96 task cards and four graph quizzes. Your purchase will included four separate sets of task cards with 24 task cards in each set. Each task card has a multiple choice word problem about the graph’s data.

    Word problems include addition, subtraction, multi-step problems, multiplication, and questions focused on interpreting graph data. Some line plots focus on measurement data to the nearest inch including fourths, halves, and three-fourths.

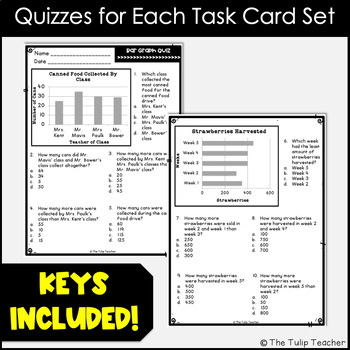
    A graph quiz aligned to each set of task cards is included. Keys for the task cards and quiz are included for quick assessing.

    Your Purchase Will Include:

    Bar Graph Task Cards and Quiz:

    - Directions

    - 24 task cards covering vertical and horizontal bar graphs

    - Student answer recording sheet

    - Task card answer key

    - Quiz over bar graphs

    - Quiz answer keys

    Pictograph Task Cards and Quiz:

    - Directions

    - 24 task pictograph task cards

    - Student answer recording sheet

    - Task card answer key

    - Quiz over pictographs

    - Quiz answer keys

    Line Plot Task Cards and Quiz:

    - Directions

    - 24 task cards covering line plots

    - Student answer recording sheet

    - Task card answer key

    - Quiz over line plots

    - Quiz answer keys

    Graph Task Cards:

    - Directions

    - 24 task cards covering bar graphs, pictographs, and line plots

    - Student answer recording sheet

    - Task card answer key

    - Quiz over mixed graphs

    - Quiz answer keys

    Take a peek at the preview for a better picture of what is included!

    Earn TPT Credits for Your Future Purchases:

    - Go to your “My Purchases” page and click “Provide Feedback.”

    To Be the First to Know About New Products and Freebies:

    - Click the star to follow me!

    Total Pages
    73 pages
    Answer Key
    Included
    Teaching Duration
    N/A
    Report this resource to TPT
    Reported resources will be reviewed by our team. Report this resource to let us know if this resource violates TPT’s content guidelines.

    Standards

    to see state-specific standards (only available in the US).
    Generate measurement data by measuring lengths of several objects to the nearest whole unit, or by making repeated measurements of the same object. Show the measurements by making a line plot, where the horizontal scale is marked off in whole-number units.
    Draw a scaled picture graph and a scaled bar graph to represent a data set with several categories. Solve one- and two-step “how many more” and “how many less” problems using information presented in scaled bar graphs. For example, draw a bar graph in which each square in the bar graph might represent 5 pets.
    Generate measurement data by measuring lengths using rulers marked with halves and fourths of an inch. Show the data by making a line plot, where the horizontal scale is marked off in appropriate units-whole numbers, halves, or quarters.
    Make a line plot to display a data set of measurements in fractions of a unit (1/2, 1/4, 1/8). Solve problems involving addition and subtraction of fractions by using information presented in line plots. For example, from a line plot find and interpret the difference in length between the longest and shortest specimens in an insect collection.

    Reviews

    Questions & Answers

    5.4k Followers