106 results
3rd grade test preparation graphing resources for Microsoft Excel
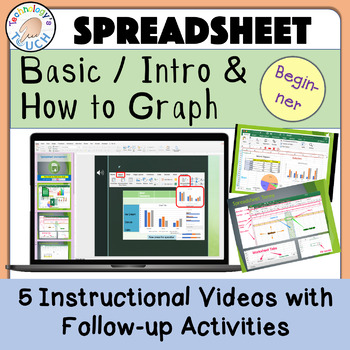
Spreadsheet - Basics Introduction & Graphing (Excel and Google Sheets)
This lesson guides students via animation and a tutorial video before completing the assignments. This is completely paperless with no prep, and lessons are done on either Microsoft Excel or Google Sheets. Students learn to enter data and start graphing. This resource is intended for learners first starting out or those who need a reminder on using spreadsheets or creating graphs. If you want your students' research papers to include eye-catching graphs, give this lesson a try. Start the slides
Subjects:
Grades:
1st - 8th
Types:
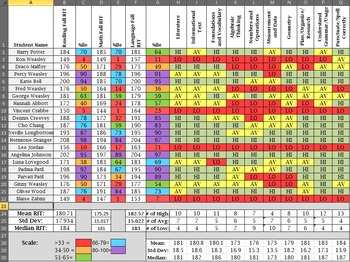
MAP Data Organizer
This is a great resources for teachers and data interventionists because it gathers the MAP data and it compacts everything into a color-coded document! What teacher doesn't love color-coded documents? This excel sheet set comes with an instructional page and 4 other Excel tabs. The tabs are broken down into MAP fall data, MAP Winter data, MAP Spring data, and MAP overall. On the MAP data pages, you will import your class roster, RIT scores for Reading, Math, and Language, and percentiles.The ex
Subjects:
Grades:
K - 12th
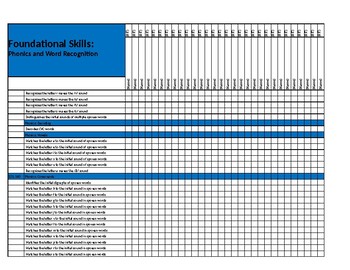
MAP NWEA READING Tracker
Excel file that takes the guess work out of tracking student Common Core standard mastery. Standards are matched and correlate with specific MAP NWEA Reading RIT bands. I used this tracker to set up my Intervention binders and follow student success. I was able to adjust my planning effortlessly, and plan reteach opportunities for small group learning by simply using this tracker.Tabs include:1. Foundational Skills *Phonics * Word recognition* Print concepts 2. Language and Writing
Grades:
K - 3rd
Types:
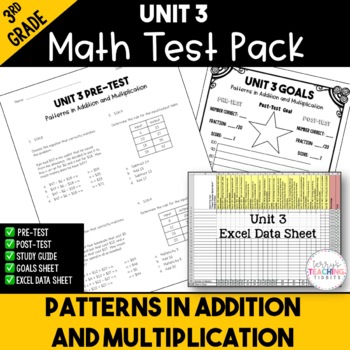
Patterns in Addition and Multiplication Printable Test Pack {3rd Grade Unit 3}
Make assessment administration incredibly easy with this printable test pack.What You Get:a printable pre-and post-test for the unit (20 questions, multiple choice)Excel data sheets to show student growth study guides to help students prepare for the post-testa student goals sheets for your class to track their growth from the beginning of the unit to the endA link to a tutorial video on how to use the Excel data sheetThis test is aligned to the Georgia Standards of Excellence Unit 3: Patterns i
Subjects:
Grades:
3rd
Types:
Also included in: 3rd Grade Printable Math Test Bundle
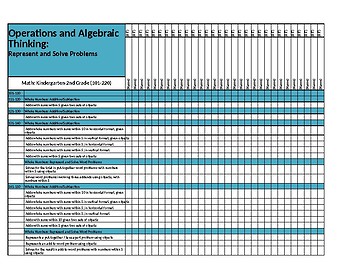
MAP NWEA Math Standards Tracker
Excel file that takes the guess work out of tracking student Common Core standard mastery. Standards are matched and correlate with specific MAP NWEA Math RIT bands. I used this tracker to set up my Intervention binders and follow student success. I was able to adjust my planning effortlessly, and plan reteach opportunities for small group learning by simply using this tracker.
Grades:
K - 3rd
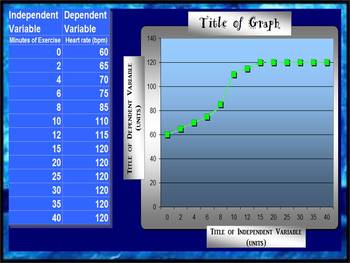
LINE GRAPH MAKER (AUTOMATIC)
This spreadsheet allows you to insert your independent and dependent variables into a chart and voila!... a line graph is generated as you enter in each piece of new data! Students love to take their data from a lab and watch as a graph is made right before their eyes! You can change all of the titles on the chart and the graph to suit your classes laboratory experiment needs! Students can easily print out their data to include in their lab reports!
Grades:
2nd - 12th
Types:
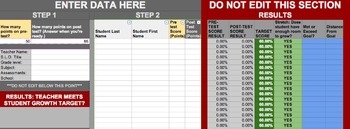
SLO GROWTH TARGET CALCULATOR, OHIO
The SLO target calculator is a useful Google spreadsheet that calculates all your student-growth targets automatically (Excel version available). Using a “close the gap by half” model, this spreadsheet takes the guessing game out of setting growth targets for students. It assigns an aggressive, yet attainable goal. Example: If a student scores 50% on their SLO pre-test, they should score 75% by the end of the year. Example: If a student scores 30% on their SLO pre-test, they should score 60%
Grades:
PreK - 12th
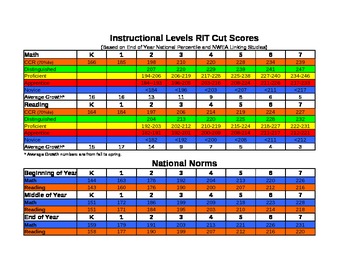
Universal AssessmentNORMS AND CUT SCORES
This NWEA MAP testing tool is used within our district. This tool is linked to numbers from the NWEA ACT Study and NWEA KPREP Study. If you do not live in the state of Kentucky you can still find a study correlating MAP RIT to achievement on your state's test and adjust the numbers. This tool is great for goal setting because it gives the average growth numbers and each student's goal before the next test should be to improve to the next color. The colors are also an excellent visual to hang
Grades:
K - 12th
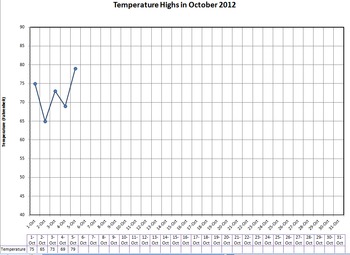
Graph Daily Temperature - with handout
Lots of downloads, are there any comments or votes for me? :)
Type in the daily temperature on your computer with your students and it will automatically graph it for you as you type. You can pre-print the monthly graph for everyone in your class and they can follow along and graph with you. I use it with calendar math or other daily activities.
Great for explaining the scales of a graph and practicing accuracy in graphing and using rulers to connect lines. Look for trends in weather and a
Subjects:
Grades:
3rd - 6th
Types:
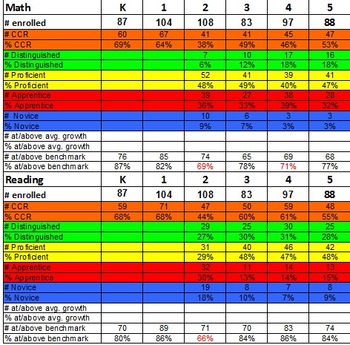
Universal Assessment Data Analysis Tool
This tool can be used to analyze district-wide, school-wide, or classroom MAP data. Simply input your data and automatically get percentages toward each instructional level (used in conjuction with MAP Testing Norms and Cut Scores, a free tool!). The percentage meeting benchmark is particularly useful because any grade with less than 75% of students at benchmark indicates a core instruction problem. Make sure your school, classroom, district is on track! Using the MAP reports feature in an Exc
Subjects:
Grades:
K - 12th

Excel Graphing Summer Fun with Digital Student Directions
The last marking period of the school year can be a challenging time to keep students engaged…they’re thinking about summer…you’re thinking about summer…#embraceitThis Summer Fun Excel project can be a perfect way to:* integrate technology* extend and enrich a math topic of study* introduce students to creating sheets and charts using ExcelProject file includes:* teacher notes/ classroom management suggestions* digital survey, using a Google Form, to collect summer activities data* digital stude
Subjects:
Grades:
3rd - 6th
Types:
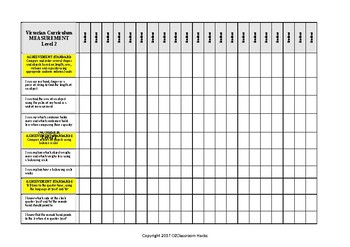
Mathematics MEASUREMENT Checklist Level 2 Victorian Curriculum 'I Can'
Level 2 Measurement Checklist aligned with the Victorian Curriculum. Fed up with recreating new checklists - ME TOO! Hope this helps. Here is a checklist completely aligned with the Victorian Curriculum, with 'I Can' statements breaking down each achievement standard. Enjoy!
Subjects:
Grades:
1st - 3rd
Types:
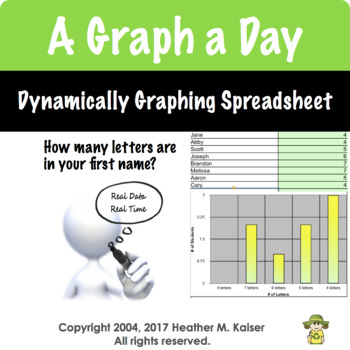
Daily Graph
If you want to integrate technology in a meaningful way, try using the daily graph questions that generate a graph in real time as students respond. This fully editable product works in Numbers, Excel, and Google Sheets.
When downloaded, this Excel spreadsheet contains 180 questions for students to answer. The teacher types their student roster 1 time. As students respond the graph is created dynamically. Teachers can customize the prompts and can upload the file as a Google Sheet that can
Grades:
3rd - 5th
Types:
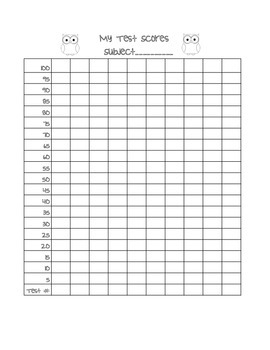
Individual Student Data Sheet
Let students take control of their testing data by using this sheet as a bar graph tracker. Students are able to track exam scores and see how well they are doing.
Grades:
PreK - 12th
Types:
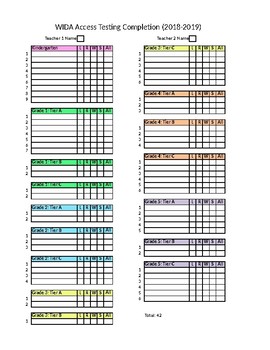
WIDA Access for ELLs Testing Domain Checklist Excel Spreadsheet Format
This is an Excel Spreadsheet you can alter/personalize for making Domain Checklists to assist you in record keeping during the WIDA Access for ELLs testing process. It is not a set product, and is meant to be customized by the purchaser. You will need to have knowledge of how to type, cut, and paste in Excel, etc. You can find videos on you tube to show you how to do those skills.This is a spreadsheet I re-use each year. I type or paste in my students names, delete extra lines except a couple fo
Subjects:
Grades:
K - 12th
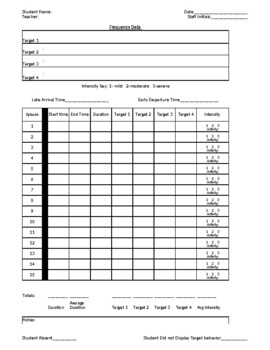
Behavior Frequency Rate Chart w/ Target, Intensity, Duration, BIP chart/Summary
Behavior Frequency Rate Chart (dates and chart cant be edited and dates changed to current year or target)--Daily Sheet-Date Entry-Intensity Chart-Duration Chart-Target Charts-BIP Evaluation printout -BIP write upSee preview for description Excel format for editing - tabs at bottom of page for easy change of view and data entry
Subjects:
Grades:
PreK - 12th
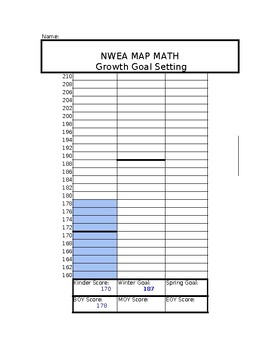
Editable: Student MAP Growth Goal Setting Spreadsheets
Perfect for goal setting based on testing scores for students
Subjects:
Grades:
PreK - 3rd
BAR GRAPH (AUTOMATIC)
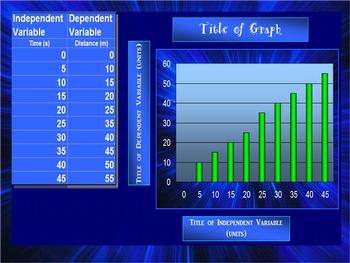
This spreadsheet allows you to insert your independent and dependent variables into a chart and voila!... a bar graph is generated as you enter in each piece of new data! Students love to take their data from a lab and watch as a graph is made right before their eyes! You can change all of the titles on the chart and the graph to suit your classes laboratory experiment needs! Students can easily print out their data to include in their lab reports!
elementary science class, middle school sc
Grades:
2nd - 12th
Types:
MAP Time Saver for 3rd Grade
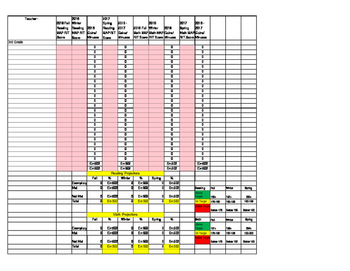
This spreadsheet has built in formulas based on NWEA's MAP cut scores for 3rd grade identifying students above grade level, on grade level, and below grade level. All you have to do is type in your student names and RIT scores for math and reading and the spreadsheet is designed to automatically calculate your data for your class.
Subjects:
Grades:
3rd
Coordinate Grids for Battleship and Spreadsheet Practice
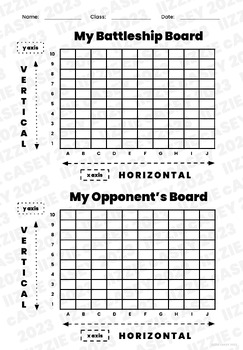
I used this resource to teach 2nd and 3rd graders how spreadsheets and coordinate grids work! We played Battleship with them.
Subjects:
Grades:
2nd - 6th
Types:

Excel Basics PowerPoint Digital
Great way to teach Excel Basics!
A review of:
• The Worksheet
• Cells
• Rows and Columns
• Numbers, Names, and Formulas
• Ranges
Next Powerpoint Presentation
Excel Autosum and Sorting – A Powerpoint Presentation
Created by CC Fisher
Grades:
K - 3rd
Also included in: Microsoft Excel YEARLY Bundle For Younger Students Digital

THE TOURNAMATOR v3 ; Game & Tournament Organizer, Automatic Rosters and Scoring!
Great for classroom competitions and parties alike. You've seen tournament templates online, they're okay for single-elimination, but what if you don't want students sitting idle after being eliminated? You need round-robin style play. Here comes, "The Tournamator"…an automatic roster and team generator, game organizer, and scoring system that will save you hours of organizing brackets and totaling scores. All you need to run it is MS-Excel or the freeware program Open Office. (downloadable
Grades:
K - 12th, Higher Education, Adult Education
Types:
How can exercise effect your heart rate? -formulas, hyperlinks, andvideo
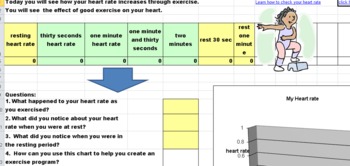
This spreadsheet is filled with an interactive graph based on real data that your students put into the spreadsheet. Their are hyperlinks for students to use (video and text for differentiation) to learn how to check their pulse. This would be a great lesson to complete for a heart healthy unit, or just to teach kids to stay active during wintery weather.
There are follow up questions that are at the bottom of the spreadsheet that will help them analyze their own data. Kids will love this les
Grades:
2nd - 6th
Types:
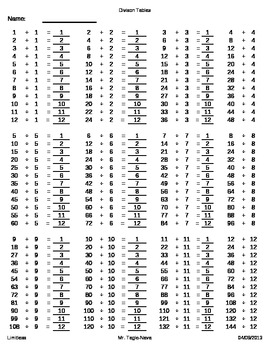
Division Tables
First tab, "division tables", provides you with division tables and the answers from 1 - 12. Second tab, "no answers", provides you with division tables without answers from 1 - 12. Third tab, "random one", provides you with a division table of your choosing dividing a random numbers from 1 - 12. Fourth tab, "random all", provides you with all the division tables 1 - 12 divided by a random number from 1 - 12. Both the third and fourth worksheet can generate a LIMITLESS amount of worksheets
Subjects:
Grades:
1st - 8th
Types:
Showing 1-24 of 106 results


