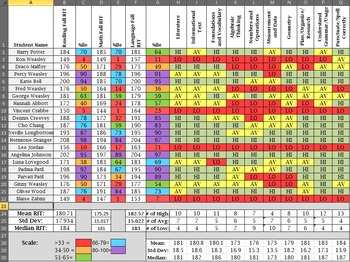
MAP Data Organizer
Teacher Mischief
82 Followers
Grade Levels
K - 12th
Subjects
Resource Type
Formats Included
- XLSX
Pages
5 pages
Teacher Mischief
82 Followers
Description
This is a great resources for teachers and data interventionists because it gathers the MAP data and it compacts everything into a color-coded document! What teacher doesn't love color-coded documents? This excel sheet set comes with an instructional page and 4 other Excel tabs. The tabs are broken down into MAP fall data, MAP Winter data, MAP Spring data, and MAP overall. On the MAP data pages, you will import your class roster, RIT scores for Reading, Math, and Language, and percentiles.The excel sheet uses a color-coded scale and it automatically adjusts to the correct percentile range. The sheet will determine the RIT standard deviation, mean, and median. The number of high, average, and low standard performance levels are also calculated. On the overall MAP data sheet, one can observe the percentile differences between Fall and Spring for each subject. One can also observe which students attained their subject goals for the year and a table calculates the number of students that passed, met, and did not meet their scores. The instructions are clearly written out on the Excel sheet and everything can be edited to your liking (range values, individualized subject strands, colors, etc).
Total Pages
5 pages
Answer Key
N/A
Teaching Duration
N/A
Last updated Jul 7th, 2014
Report this resource to TPT
Reported resources will be reviewed by our team. Report this resource to let us know if this resource violates TPT’s content guidelines.


