4 results
2nd grade Common Core 3.MD.B.3 resources for SMART Notebook
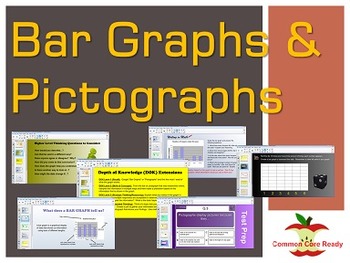
Bar Graphs & Pictographs for Measurement / Data for the SMART Board
Bar Graphs & Pictographs for Measurement / Data for the SMART BoardIn this SMART Board Common Core Bar & Pictograph lesson, students will create and draw a scaled picture graph and a scaled bar graph to represent a data set with several categories. Solve one- and two-step “how many more” and “how many less” problems using information presented in scaled bar graphs. For example, draw a bar graph in which each square in the bar graph might represent 5 pets.This interactive SMART Board less
Subjects:
Grades:
2nd - 4th
Fall Math using the Smart Board
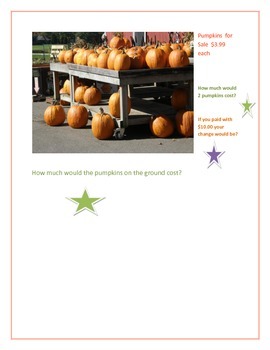
Fall Math is a set of eleven activities for 3rd grade common core. This could also be used as enrichment for grade 2 or review for students in grade 4. Each page has one of my original photos(mainly pumpkins and fall trees) from the New England area with multiple activities per page. Activities include telling time to the minute, measurement, multiplication, using bar graphs, fractions, and multiple step word problems. Each page has the answers given with an interactive device so students c
Subjects:
Grades:
2nd - 4th

Graphs through Notebook
Get your students up and engaged with Interactive Graphs! This set includes pages for your students to practice skills related to: Bar Graphs, Line Graphs , Pictographs, Coordinate Graphs, and Venn Diagrams. Interactive for students on SmartBoard through Notebook. Line graph and coordinate graph have adjustable points to challenge students and allow for multiple uses.
Subjects:
Grades:
2nd - 6th
Types:

Picture Graphs and Questions CCSS
In this SMART lesson, students will interpret picture graphs and answer math questions based on the graph.
3.MD.B.3 Draw a scaled picture graph and a scaled bar graph to represent a data set with several categories. Solve one- and two-step "how many more" and "how many less" problems using information presented in scaled bar graphs
Subjects:
Grades:
2nd - 4th
Showing 1-4 of 4 results

