Bar Graphs & Pictographs for Measurement / Data for the SMART Board
- NOTEBOOK (SMARTboard) File
Description
Bar Graphs & Pictographs for Measurement / Data for the SMART Board
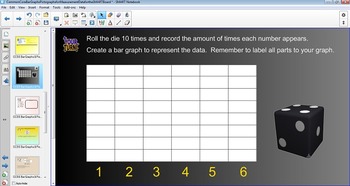
In this SMART Board Common Core Bar & Pictograph lesson, students will create and draw a scaled picture graph and a scaled bar graph to represent a data set with several categories. Solve one- and two-step “how many more” and “how many less” problems using information presented in scaled bar graphs. For example, draw a bar graph in which each square in the bar graph might represent 5 pets.
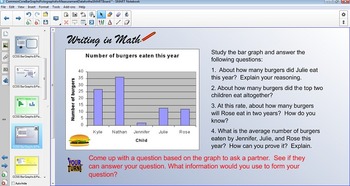
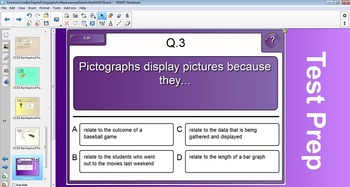
This interactive SMART Board lesson includes real-world problems, writing in math, as well as interactive test prep problems. *NEW* Higher Level Thinking Questions and Depth of Knowledge Extensions!
☰ This product can be imported into Promethean ActivInspire (Click File--->Import--->and choose your SMART Notebook file to open)
HOME SCHOOL USERS: Use the SMART Interactive Viewer
(a FREE SMART Technologies application that will allow you to view and use this file).
Common Core State Standards Addressed:
Measurement & Data
Represent and interpret data.
3. Draw a scaled picture graph and a scaled bar graph to represent a data set with several categories. Solve one- and two-step “how many more” and “how many less” problems using information presented in scaled bar graphs. For example, draw a bar graph in which each square in the bar graph might represent 5 pets.
10. Draw a picture graph and a bar graph (with single-unit scale) to represent a data set with up to four categories. Solve simple put-together, take-apart, and compare problems 1 using information presented in a bar graph.
© Copyright MrTechnology, 2013


