35 results
Middle school simulations for Microsoft Excel
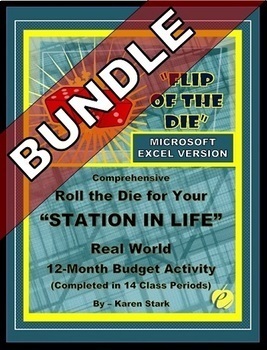
Financial Literacy - Budgeting - Money Management: 14-Day MS-EXCEL Simulation
FINANCIAL LITERACY - BUDGETING - MONEY MANAGEMENT 14-Day MS-EXCEL VERSION SIMULATION – is a very comprehensive, exciting, and interactive computerized real world turn-key activity/simulation whereby students “Flip the Die” for their “Station in Life” and experience “The Real World” according to the roll of the die -- it is guaranteed to keep students “on their toes! This simulation can be used for years to come and in all disciplines — it never becomes obsolete. This version has been created
Grades:
8th - 12th
Types:
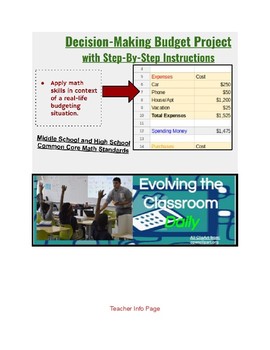
Budget Spreadsheet Project (personal finance & math skills)
A step-by-step project with detailed instructions on how to set up an Excel spreadsheet budget. Students will apply math skills in context of a real-life budgeting situation.
Students will create a budget:
-Based on their future career choice.
-Independently by following the instructions using an Excel Spreadsheet.
-Over the course of at least 2 class periods (typically students take at least 2.5 hours to complete this project).
Subjects:
Grades:
6th - 12th
Types:
CCSS:
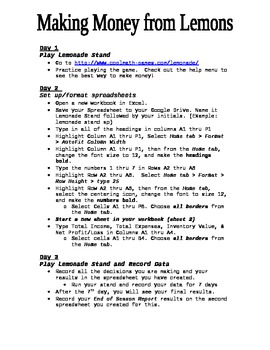
Making Money from Lemons--Microsoft Excel 2010 Project
This is an updated version of a previously posted project. This version is updated to reflect the Microsoft Office 2010 format. Students play a fun game that requires them to figure out how to make the most profit from their own "Lemonade Stand". Students will learn to create a spreadsheet that keeps track sales profit and loss. They will also create a graph that shows a sales report at the end of their "season".
Grades:
7th - 12th, Adult Education
Types:
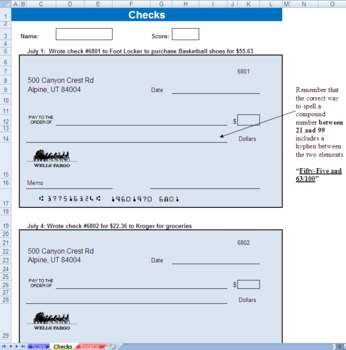
Financial Literacy Checking Assignment (check writing)
This is an assignment to teach students how to write checks and balance a checkbook. It is an interactive Excel Spreadsheet and self scores if the student completes it on the computer.
There are two parts to the assignment. The first part has the students correctly fill out 8 checks based on prompts given to them. The 2nd part uses those 8 checks and other non-check transactions to teach them how to fill out and balance a check register.
Also included is a .pdf printable version of the ass
Subjects:
Grades:
6th - 12th, Adult Education
Types:
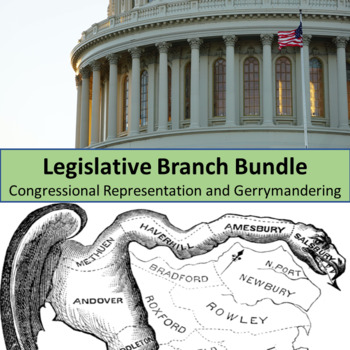
Congressional Apportionment, Representation, and Gerrymandering
Now that the 2020 U.S. Census and apportionment have been completed, we can start to see who has the most representation in Congress and who has the best ratio of population to Congress members. These data points, along with how districts are manipulated via gerrymandering, are addressed in these products.Questions?Email me at inquiryforTDSR@gmail.comThank You For Your Purchase!If you enjoyed this product you can let other teachers know by leaving a review. You'll earn TpT Credits when you do! I
Subjects:
Grades:
7th - 12th
Types:
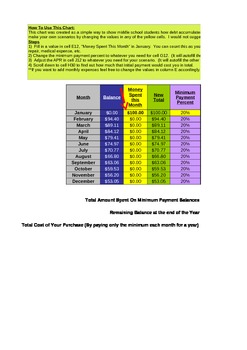
Why Paying the Minimum is Bad - Credit Card Debt Calculator - Percents
This Excel file is set up to show students how quickly debt can add up if they only pay the minimum balance on a credit card. The spreadsheet is already formatted to do the calculations for you! All you have to change is your initial credit card balance and change the APR and minimum payment balance to fit different scenarios. This is a quick way to show your students the "big picture" when it comes to credit card debt. It is also a nice way to introduce students to applications of percents
Subjects:
Grades:
7th - 10th
Types:
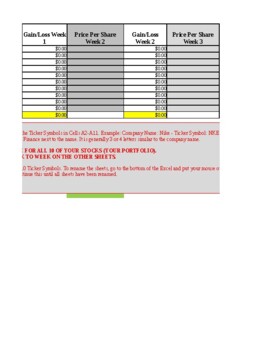
Stock Market Simulation Excel Spreadsheet
This is an Excel spreadsheet all ready set-up with formulas to calculate the gains and losses for a stock market simulation. It is set-up for students to purchase 10 stocks in their portfolio and then they will track the stocks over 11 weeks. There is a main spreadsheet to track the portfolio gains and losses and individual sheets to track each stocks gain or loss. You can give your students as much money as you would like for them to spend and the spreadsheet will automatically total how much t
Subjects:
Grades:
8th - 12th, Higher Education
Types:
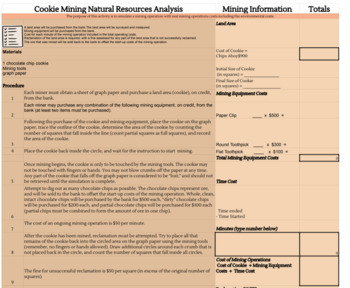
Cookie Mining-Natural Resources Google App Sheet
In this Google Sheet simulation students mine "ore," chocolate chips from a chocolate chip cookie to demonstrate real mining operations and the environmental price. Students complete the cost analysis google sheet choosing mining equipment, mining operation time, and reclamation methods. The google sheet can be used as is with the included formulas, or students can create the formulas using computer application skills. Two short essay responses are included. STEM ReadyReal-World ApplicationG
Grades:
6th - 9th
Types:

Planning Documents for Reality Check
Starting package for the Reality Check- Budget Experience Bundle.This package includes all of the planning templates you need to run your own experience. It includes timelines, tasks, planner pages and useful documents.
Subjects:
Grades:
7th - 12th
Types:
Also included in: Reality Check- Budgeting Experience

Personal Finance Project: Final Budget Excel Sheet
Final budget excel sheet
Subjects:
Grades:
6th - 12th, Higher Education, Adult Education
Types:
CCSS:
Also included in: Personal Finance Project: Complete Budget Project
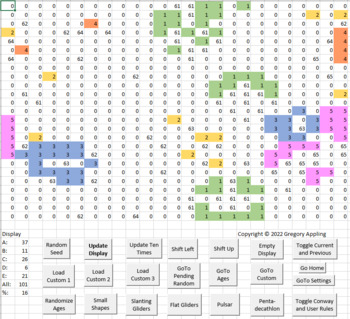
Life Simulation Spreadsheet
Some of your students may spend hours tinkering with this macro-assisted, life-simulating Excel spreadsheet to study and appreciate ecology, and to see how the spreadsheet program achieves complex purposes. The product is best used as an exploration opportunity for single students or pairs of students. Mathematician John Conway’s simple rules for simulating a life form (1970) are the starting point for the spreadsheet. Multiple enhancements let the student create, compare, and contrast up to f
Grades:
6th - 12th

Mock 2012 Presidential Election Voting Booth
This is a great mock presidential election program written in Excel. It notifies the voter that they have voted so the students can be sure their vote registered. It has a separate tab showing the voting tallies that can be easily reset if it being used for multiple classes. A final tab displays a 3D bar graph of the results. Both the tally tab and the graph tab can be toggled to at anytime. This is very user friendly and I am excited about using it in my classroom on Super Tuesday to let m
Subjects:
Grades:
2nd - 12th
Types:
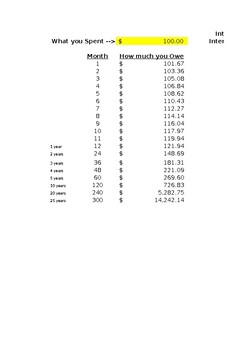
Credit Card Interest Example Excel Spreadsheet
An easy to understand and simple way to introduce students to how credit card interest can works and how quickly debt can build up. Simply fill in the two highlighted cells with the credit card rate and how much was spent on the card and the spreadsheet will self populate to show the first 12 months, two years, three years, four years, five years, ten years, 10 years, 20 years and 25 years. A must see for all future credit card owners and a great way to show the real-life application of decimals
Subjects:
Grades:
6th - 12th
Types:
Also included in: Pre-Algebra Real-Life Applications
Demonstrate Ordering Numbers with an Animated Excel File
Simple to use animated Excel file for in class demonstration of Ordering Numbers from whole numbers, integers, positive rational, rational, and real numbers. Self-correcting quiz format that automatically generates a new set of numbers. Move scroll bars, select option buttons, type numbers, and watch these mathematical concepts come alive. You must use Microsoft Excel that is capable of opening file formats in either .xlsx or .xlsm.
Subjects:
Grades:
4th - 12th
Types:
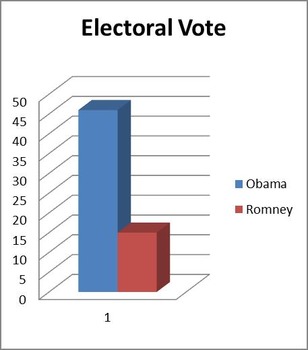
Election Graphs
Hold elections in your classroom and use these graphs to show results of presidential and local elections. All you have to do is fill in the names of the candidates and decide how many electoral votes each class will have!
Students will be able to compare popular and electoral votes and see how many votes each candidate receives! This spreadsheet is great as a supplement to a lesson on elections.
Subjects:
Grades:
6th - 12th
Types:
Demonstrate Linear Equations in 2 Variable Graphs with an Animated Excel File
Simple to use animated Excel file for in class demonstration of Linear Equations in 2 Variables. Equation formats include general form, slope-intercept form, point-slope form, and point-point form. Move scroll bars, select option buttons, type numbers, and watch these mathematical concepts come alive. You must use Microsoft Excel that is capable of opening file formats in either .xlsx or .xlsm.
Subjects:
Grades:
8th - 12th
Types:

Interactive Power Pole Understanding Positive and Negative Numbers
This interactive exercise allows students to see in real time the logic of positive and negative numbers. It is a real life scenario as a new employee of a power company, they must learn how to set a power pole. By entering the length of the pole in the first column, and how deep of a hole the pole must be placed in as a negative number, the resulting amount is populated in the third column which represents the amont of the pole that will remain above ground. In the chart to the right, studen
Subjects:
Grades:
PreK - 12th, Higher Education, Adult Education, Staff
Types:
Demonstrate Absolute Value Equality in 2 Variables with an Animated Excel File
Simple to use animated Excel file for in class demonstration of solutions to absolute value equalities in 2 variables such as y=|x|, y=a|x|, y=a|x+b|, and y=a|x+b|+c. Move scroll bars, select option buttons, type numbers, and watch these mathematical concepts come alive. You must use Microsoft Excel that is capable of opening file formats in either .xlsx or .xlsm.
Grades:
7th - 12th
Types:
Demonstrate Absolute Value Equalities in 1 Variable with an Animated Excel File
Simple to use animated Excel file for in class demonstration of solutions to absolute value equalities in 1 variable such as |x|=d, |x-b|=d, a|x-b|=d, and a|x-b|+c=d. Move scroll bars, select option buttons, type numbers, and watch these mathematical concepts come alive. You must use Microsoft Excel that is capable of opening file formats in either .xlsx or .xlsm.
Grades:
7th - 12th
Types:
Demonstrate One-Variable Equations in 2-Dimensions with an Animated Excel File
Simple to use animated Excel file for in class demonstration of One-Variable Equations in 2-Dimensions. Graph types include vertical (x=c), horizontal (y=c), and both types on one graph. Move scroll bars, select option buttons, type numbers, and watch these mathematical concepts come alive. You must use Microsoft Excel that is capable of opening file formats in either .xlsx or .xlsm.
Subjects:
Grades:
7th - 12th
Types:
Demonstrate Basic Statistics Plots with an Animated Excel File
Simple to use animated Excel file for in class demonstration of Basic Stem-n-Leaf plot, Box and Whisker plot, and Frequency plot. Move scroll bars, select option buttons, type numbers, and watch these mathematical concepts come alive. You must use Microsoft Excel that is capable of opening file formats in either .xlsx or .xlsm.
Grades:
6th - 12th
Types:
Coding for Physics - Projectile Motion
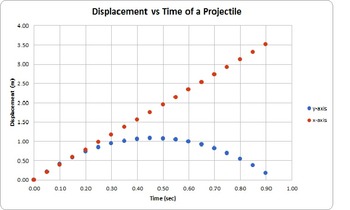
A spreadsheet template that teaches simple mathematical coding in order to solve equations of motion. Includes a video demonstration of how to write all code. Once complete, students may input initial conditions and computer will auto-calculate displacement in two axis (x-axis or range, y-axis or height) and velocity in both axis and then graphs results.
Teacher's Edition is hidden on each page with additional video resources, and link to Google Sheets version of this activity. To find open
Grades:
7th - 10th
Types:
Demonstrate Compare Basic Statistical Graphs with an Animated Excel File
Simple to use animated Excel file for in class demonstration of comparing basic statistical graphs such as XY-scatter, Line, Column, Bar/Histogram, Area, and Pie, with the ability to select Ribbon, 3-d Column, 3-d Bar, 3-d Area, or 3-d Pie. Move scroll bars, select option buttons, type numbers, and watch these mathematical concepts come alive. You must use Microsoft Excel that is capable of opening file formats in either .xlsx or .xlsm.
Grades:
6th - 12th
Types:
Demonstrate Slopes of Parallel & Perpendicular Lines with an Animated Excel File
Simple to use animated Excel file for in class demonstration of Slopes of Parallel and Perpendicular Lines. Move scroll bars, select option buttons, type numbers, and watch these mathematical concepts come alive. You must use Microsoft Excel that is capable of opening file formats in either .xlsx or .xlsm.
Grades:
7th - 12th
Types:
Showing 1-24 of 35 results

