21 results
High school algebra simulations for Microsoft Word
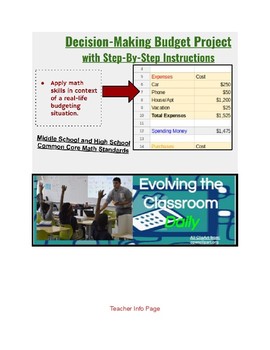
Budget Spreadsheet Project (personal finance & math skills)
A step-by-step project with detailed instructions on how to set up an Excel spreadsheet budget. Students will apply math skills in context of a real-life budgeting situation.
Students will create a budget:
-Based on their future career choice.
-Independently by following the instructions using an Excel Spreadsheet.
-Over the course of at least 2 class periods (typically students take at least 2.5 hours to complete this project).
Subjects:
Grades:
6th - 12th
Types:
CCSS:
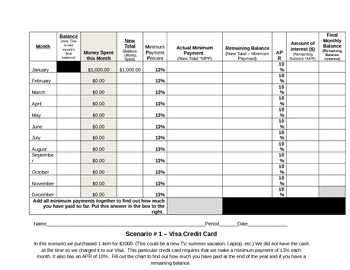
Percents: Understanding Credit Card Debt Worksheet for Student - Scenario 1
The question listed on Scenario 1 is as follows:
"In this scenario we purchased 1 item for $1000. (This could be a new TV, summer vacation, Laptop, etc.) We did not have the cash at the time so we charged it to our Visa. This particular credit card requires that we make a minimum payment of 13% each month. It also has an APR of 10%. Fill out the chart to find out how much you have paid at the end of the year and if you have a remaining balance. "
The chart is a great way for students to disc
Subjects:
Grades:
7th - 10th
Types:
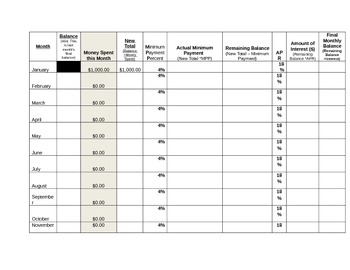
Real Life Math: Percents: Credit Card Debt Worksheet - Scenario # 2
The scenario on this chart is as follows:
"MasterCard sent you a fabulous new credit card offer in the mail. It is a special card for teens with really low minimum monthly payment percent of 4%. In exchange for the low minimum monthly payment percent, MasterCard raised your APR to 18%. You decide to use this credit card instead of the Visa in Scenario #1. Fill out the chart and determine the amount of money you spent and your remaining balance. "
The chart is a great way for students to di
Grades:
7th - 10th
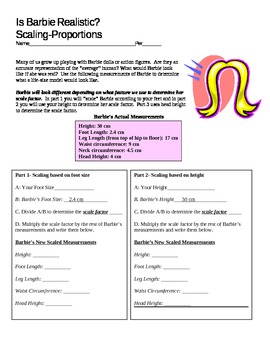
What would Barbie Look like if she were Real?
Ever wondered what Barbie would look like if she were real? Now you can work with your students to find out!
Part 3
In order to save you and your students time, I measured various segments of Barbie's actual doll measurements. Students can use their measurements from Parts 1 and 2 of the Human Body Proportion Lab (available on TCP) OR measure their height or foot size to determine the SCALE FACTOR between their body and the doll's body. Using the SF, students will determine Barbie's measure
Subjects:
Grades:
7th - 10th, Higher Education, Adult Education
Types:
Statistics Mode, Median, Mean, Range Worksheet for Math or Psychology
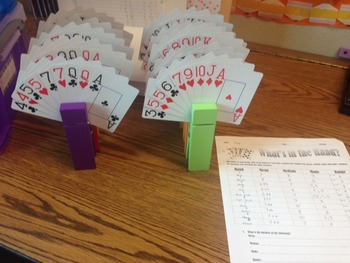
What's in the Hand: Activity makes learning mode, median, mean, and range fun. You will need two packs of playing cards in order to use 10 different variations. I use giant clothes pins to hold a total of 9 cards for each station. Each student gets a worksheet and is assigned to a group of 4-5 students. Students will complete the first rotation by figuring the mean, median, mode, and range, and then rotate to each other station in about 5 min intervals. At the end they will answer the questions
Subjects:
Grades:
5th - 12th
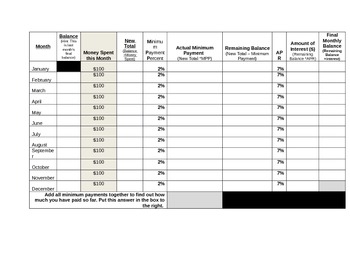
Percents: Understanding Credit Card Debt Worksheet for Students - Scenario 3
This chart covers the following scenario:
"Capital One offers a special credit card for teens. It has a spending limit of $100 per month and a very low monthly payment of 2%. The APR for this card is also pretty low at 7%. You talk to your parents and they agree that it sounds safe so they cosign the card with you. You now have your own credit card to use for monthly purchases and do not have to constantly ask your parents for money. You will owe your parents the remaining balance at the end
Grades:
7th - 10th
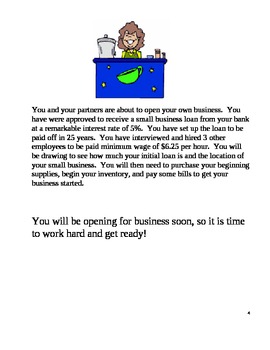
Concession Stand - A Full Unit Business Simulation
Concession Stand is a business simulation for grades 8 - 12. Students will open a business and use their math skills to complete order forms, update inventory, pay bills, keep a ledger, and open for days of sale. This project works with higher level Blooms Taxonomy and allows students to work together in groups.
Subjects:
Grades:
8th - 12th
Types:
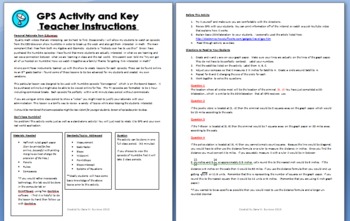
GPS Simulation - Applications of Algebra and Geometry - Aligned with Numb3rs
Are you tired of hearing your students say "When would you ever use this!?" This lesson is a perfect way to silence their complaints!
I originally designed this lesson to be used after watching the episode "Convergence"of the CBS television series Numb3rs. I think every middle/HS teacher should own copies of this series. If you aren't familiar with the show, it is basically a crime show where the characters solve crimes with math. (Similar to CSI) You might be able to download free episodes
Grades:
8th - 12th
Types:
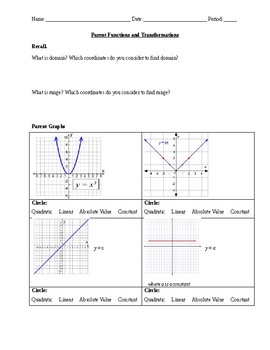
Transformations Discovery Activity
This is a discovery activity dealing with transformations of absolute value graphs, constant graphs, linear graphs, and quadratic graphs. Students will use sliders on Desmos Online Graphing Calculator to see how each variable affects the parent graph of a function. Students will then draw conclusions and answer questions about similar functions without looking at the graph based on what they discovered. Note: You will need computers. We suggest pairing students in groups of two.
Grades:
9th - 11th
Types:
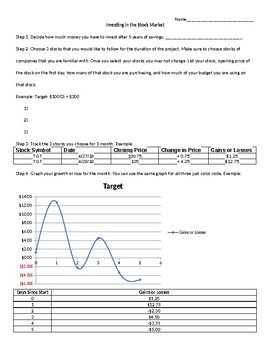
Investing in the Stock Market
This project was created for a consumer math class. It has the students selecting 3 stocks, and buying different amounts based on their budget (I chose budgets and had them draw from a hat). Students will then track the 3 stocks for a month (I have them back track dates on Yahoo! Finance's History tab), and then graphing their gains or losses. Students will then finish by summarizing their month.
Subjects:
Grades:
9th - 12th
Types:

What would Barbie Look like if she were Real? Part 3 and 4 - Body Proportions
Ever wondered what Barbie would look like if she were real? Now you can work with your students to find out!
Part 3
In order to save you and your students time, I measured various segments of Barbie's actual doll measurements. Students can use their measurements from Parts 1 and 2 of the Human Body Proportion Lab (available on TCP) OR measure their height or foot size to determine the SCALE FACTOR between their body and the doll's body. Using the SF, students will determine Barbie's measure
Subjects:
Grades:
7th - 10th, Higher Education, Adult Education
Types:
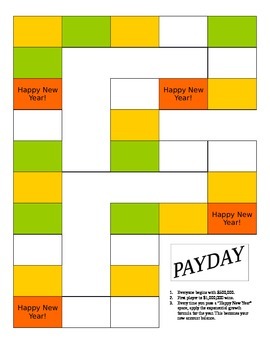
Payday - Exponential Growth Board Game for Algebra
Payday is an awesome interactive board game similar to the game of Life. Students start with $400,000 and life events cause them to gain or lose money. At the end of each year, students calculate the yearly exponential growth to get their new balance. The first student to $1,000,000 wins.
Students are involved and excited to play this game. This is a good formative assessment tool to see if student understand this algebraic topic. The student score sheet is a way to collect their work and asse
Subjects:
Grades:
9th - 12th
Types:
CCSS:
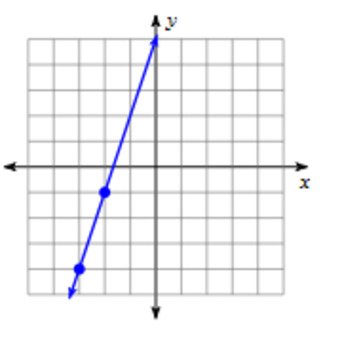
Algebra 1 EOC 2018-19 Practice Test
This multiple choice (5 options per questions) exam has been formulated to conform to the latest standards and will help students gauge how well they are prepared to take the EOC in 2018-19. There are 60 questions including questions on Statistical Models. There are also some free response questions.
Subjects:
Grades:
8th - 12th
Types:

Fireworks Show Entry Doc for Algebra I or II (Quadratics Project PBL)
Engage your math students in authentic, real world learning by helping them plan a fireworks show! This product includes two versions of an entry document to launch a PBL unit on quadratics. The document is a Microsoft Word Doc so you can make edits where needed. The first includes a more detailed plan for Algebra II students who will cover vertex, standard, and intercept form, transformations of quadratics, and solving equations with factoring, complete the square, and the quadratic formula. Th
Subjects:
Grades:
8th - 11th
Types:
Also included in: Quadratics Resource Bundle (PBL PrBL Explorations + Projects)
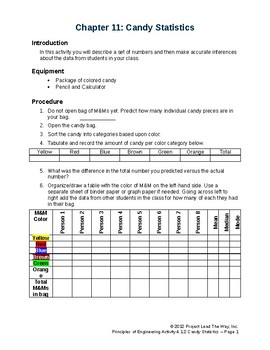
Candy Statistics
Kids have a chance to open individual bags of M&Ms and practice calculating probability of different colors and solving probability problems both independent and dependent.
Subjects:
Grades:
9th - 12th
Types:
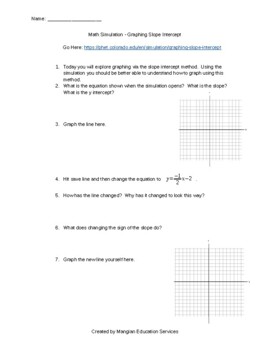
Virtual - Slope Intercept Learning Simulation
Using the simulation by phet, students can better understand how changing the slope and y intercept change their graphs.
Subjects:
Grades:
7th - 10th
Types:
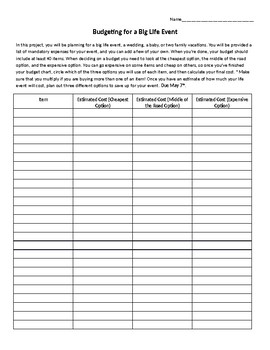
Budgeting for A Big Life Event
This was created for a Consumer Math Course. It has students research, and create a budget for a Big Life Event (a wedding, a baby, or two vacations for a family of 4). It provides a list of essential items for each option, and leaves a few blank for students to add their own items. It also has them look at the different qualities for items, and budget in different situations.
Subjects:
Grades:
9th - 12th
Types:
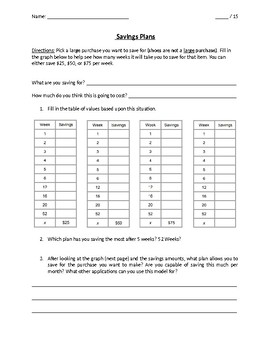
Personal Consumer Math Savings Plan
This activity helps students see the difference in saving different amounts of money at over similar time periods. Most students we talk with are very nearsighted when saving money, and this will help them see how fast savings add up over the course of several weeks to a year. It will also help students create goals in saving to help purchase a "big ticket item." Students have different tables to enter their weekly savings, and after they complete they will graph the savings on a unlabeled graph
Subjects:
Grades:
7th - 12th, Adult Education
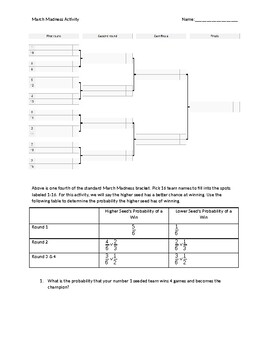
March "Math"ness Probability
I designed this activity to show how likely making a perfect bracket really is. It engages students in a fun probability activity where they can calculate a probability and also see probability in action. Students have to pick 16 teams (real or fictional) and determine who they think the winners will be in each game. After answering a few probability questions, they will use a die to determine the winners of each game. Then they will see if they would have won a bracket challenge.
Subjects:
Grades:
9th - 12th
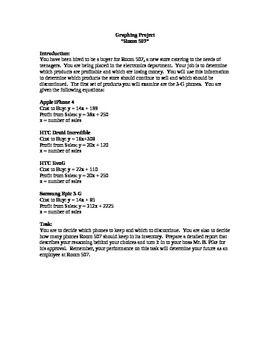
Room 507 - A Graphing Extension
This project is designed to be an extension after finishing a unit on Graphing Lines. Students are required to make decisions about the profitability of different types of cell phones. They use their skills of slope, y-intercept, parallel, and intersections to determine how many of each type of phone they should carry, if they carry the phone at all. They are then required to write a report explaining their decisions and how they arrived at them. A great activity that meets the standards of
Grades:
7th - 12th
Types:
Showing 1-21 of 21 results


