17 results
Laboratories for Microsoft Excel $5-10

BACK TO SCHOOL BUBBLEGUM SCIENCE LAB
Break the ice of the first few days of back to school science class, while teaching your students your expectations of how to write an excellent lab report. This fun, high interest student lab does just that. In groups of three, students will chew bubblegum and measure the bubbles to see if sugar free bubblegum makes bigger bubbles than regular bubblegum. Students can collect their data on the form provided and use our pre-formatted Microsoft Excel spreadsheet to create a line chart and colu
Subjects:
Grades:
7th - 12th
Types:
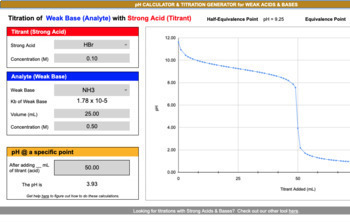
pH Calculator & Titration Curve Generator - WEAK Acids & Bases
We created this useful online titration curve generator and pH calculator tool so that you can enjoy effortless, reliable and quick acid-base titration reaction calculations. In addition to viewing the titration curve generated from a variety of weak acid and base choices, the major points on the curve are also included: equivalence and half-equivalence points. Interested to know the pH at a specific point according to different volume and molarity inputs? You are in luck. This tool allows you
Subjects:
Grades:
7th - 12th, Higher Education, Adult Education
Types:
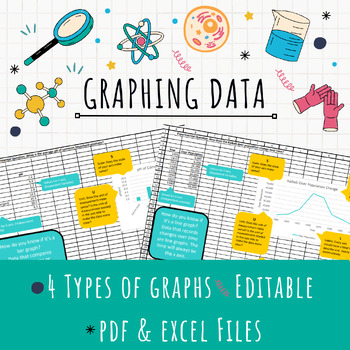
EDITABLE Excel Graphing Template
Teach graphing in Excel with this EDITABLE template! After collecting data, have your students represent it in a formal graph using Excel. This template provides helpful tips for students to determine the right kind of graph (bar, line, or pie) for their data and ALSO teaches them all the important parts of a graph.Assign the template for students to download and edit for a quick graphing solution or provide the pdf handouts for students who just need a little guidance!4 different kinds of graph
Grades:
7th - 12th
Types:

Regular Bell Schedule
Use this to remember your classes, customize to your school (colors too!), print and tape on your laptop so you won't forget during class!
Grades:
Not Grade Specific
Types:
Also included in: Back to School Bundle
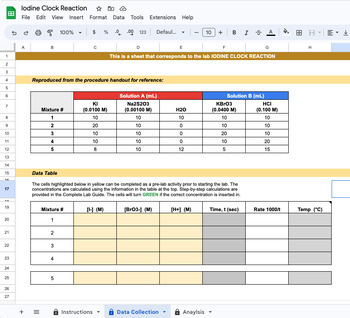
Iodine Clock Reaction - GoogleSheet Data & Analysis Tool
This product relates to the popular chemistry lab: Iodine Clock Reaction. Often performed as a demo for students, this is a hands-on lab that students can explore determining rate laws through this reaction. Check out the lab procedure for FREE here. This Guided Lab Analysis tool provides a structured way to enter data and then have the calculations performed for you automatically! This is great for:Quick way to check student work and calculationsCalculations can automatically be completed once
Subjects:
Grades:
8th - 12th, Higher Education, Adult Education
Types:

Interactions and Ecosystems Activity Bundle
Designed to support hands-on environmental education. Includes a FREE long-range planner template!Originally designed for use in the Alberta Science 7 Curriculum. I have taught these lessons for a few years and students have been engaged and excited throughout the lessons. Requires minimal planning and materials, and each can be done in one 60 min class.
Subjects:
Grades:
6th - 9th
Types:
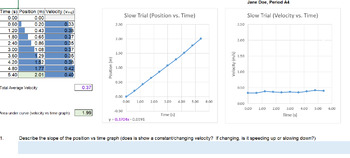
Water Droplet Velocity and Displacement Activity
This is a fairly simple to perform data collection activity to illustrate the concepts of one-dimensional motion and the associated graphing techniques. Students will use plastic water bottles to perform a series of motions and collect data. The data can then be analyzed using included Excel automatically calculating workbooks in two follow-up lessons. This activity can easily be performed in a distance learning setting as it uses materials found in most households.
Subjects:
Grades:
8th - 12th
Types:
CCSS:
NGSS:
HS-PS2-1
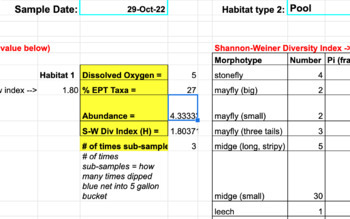
Stream Ecology: Benthic Macroinvertebrate Data Sheet (Part 4)
Data sheet in google sheets which is template for collecting/analyzing data for stream ecology sampling lab for Benthic Macroinvertebrates (Stream Bugs/Aquatic Insects) to middle, high school, or college students! Includes calculations on Biodiversity (% EPT Taxa, Dissolved Oxygen, and Shannon-Wiener Index). This spreadsheet can accomodate many different sampling groups and tabulates results in final sheet.~~ Note: this is PART 4 of larger STREAM ECOLOGY AQUATIC INSECT SAMPLING bundle - you can
Subjects:
Grades:
9th - 12th, Higher Education
Types:
NGSS:
HS-LS2-3
, HS-LS2-4
, HS-LS2-1
, HS-LS2-6
, HS-LS2-2
Also included in: Stream Ecology Lab: Benthic Macroinvertebrates (FULL BUNDLE!)
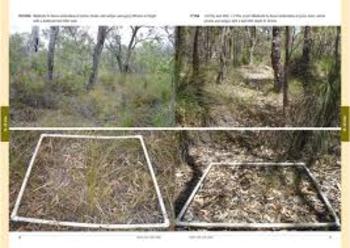
Ecology Lab: Micro-Plot sampling and graphing
Combined with field work (access to a forest is required), students collect data, and then return to class to use the data in two separate graphs. They create a paper-and-pencil graph, and they follow a set of detailed instructions to use their data in order to complete a graph using Microsoft Excel.
Subjects:
Grades:
4th - 6th
Types:
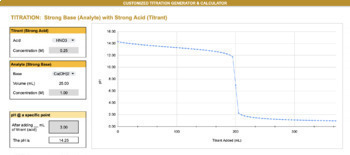
pH Calculator & Titration Curve Generator - Strong Acids & Bases
Create your own customized titration curves within seconds for worksheets, assessments, handouts or any other use!This resource comes with TWO generators/ calculators: 1. A titration of a strong acid with a strong base and 2. A titration of a strong base with a strong acid The customized generator allows YOU to CHOOSE:Chemical identity of the titrant AND analyteVolume of analyte being titratedConcentration of the analyteConcentration of the titrantPick and choose what combinations you
Subjects:
Grades:
6th - 12th, Higher Education
Types:
NGSS:
HS-PS1-7
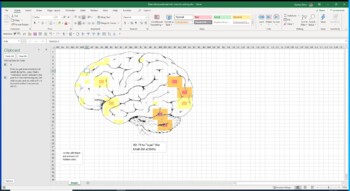
Lab Brain Scan Analysis Class Activity Psychology Neurology AP Psychology
This was originally the proof of concept spreadsheet for my brain scan lab. I realized that it might be useful on its own as an activity. You have to have excel to make this work,…I guess you might be able to use it with google sheets but I don’t know. Open the spreadsheet, and hit F9 to get a fresh “scan.” Areas with the most “activity” “light up.” You can edit the spreadsheet and change the colors if you want,…not sure that is necessary but it is fully editable. So how might you use this? May
Subjects:
Grades:
9th - 12th, Higher Education
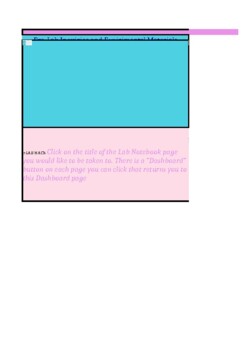
Waves Lab Electronic Notebook : ELN: Waves Unit
Electronic/Digital Lab Notebook in Google Sheets, Numbers and Excel. I created this to streamline the Lab Process. It can be paired with IoT sensors.This Lab Notebook is divided up into a Dashboard, Pre-Lab Inquiries, Observations Log, Data Analysis, and Post-Lab Inquiries.This meets the Scientific Process and Science Inquiry requirements. The Observation Log houses the unit's vocabulary with links to the definitions so students can reference itas they enter data. There is an automatic graph, Ti
Grades:
6th - 12th
Types:

Homeostasis Heart Rate Lab
This lab can be used for middle school sciences, any Biology-based science class, or mathematics statistics classes. Included are a word document with instructions, lab, an excel spreadsheet with example data, a blank sheet with formulas that will calculate data, and a PowerPoint with student instructions.
Subjects:
Grades:
6th - 12th, Higher Education
Types:
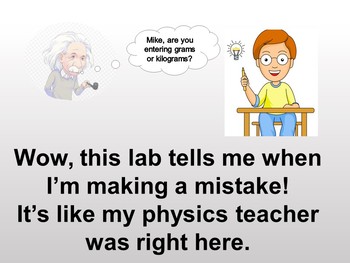
Physics Lab Bundle: Interactive Spreadsheets
When run on a computer these 11 labs act like a teacher, flagging possible errors and encouraging students to do their best. They’re the result of my 13 years’ experience and are designed for an algebra-based physics course. All the files are templates, so they can’t be accidentally over-written. These interactive labs help students get the most out of the lab experience. When needed, error messages pop up addressing students by name, e.g.: “Mike, your calculations don’t follow from your input d
Grades:
10th - 12th, Higher Education
Types:
Predesigned Spreadsheet Solutions for Consumers and Business
Library of predesigned spreadsheet solutions useful for consumers and businesses. Included in this library are advanced spreadsheet solutions in support of finance and economics teaching as well as personal finance and planning. The spreadsheets can be used with Excel, Google Sheets and most open source electronic spreadsheets.
Subjects:
Grades:
Higher Education, Adult Education, Staff
Types:
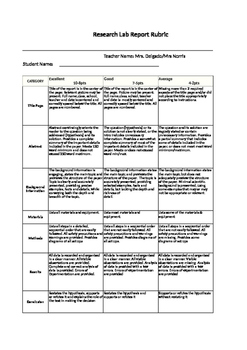
Research Lab Report Rubric
This is a qualitative rubric of expectations for a research based lab report, ranging from excellent, good, average, and below average qualities for the various components. Components include a title page, abstract, background information, materials, methods, results, conclusion, bibliography, format, and logbook.
Subjects:
Grades:
8th - 12th
Types:

Human power lab - calculations
This lab allows students to workout in a weight room and measure the power of major muscle groups. There is a worksheet to record data on paper while working out, and a google sheet to automatically calculate the work done and power used for each exercise. Of course, you could have the students calculate everything themselves, but this is used as an introduction to power before we break out the calculators. The final google doc is a set of four conclusion questions.
Subjects:
Grades:
9th - 12th
Types:
Also included in: Human Power Lab Bundle
Showing 1-17 of 17 results

