5 results
Statistics Common Core 6.SP.B.4 laboratories
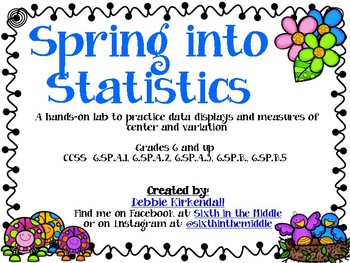
Spring into Statistics Data Displays and Measures of Center Lab
This is a hands-on lab that teaches about Statistical Questions, Data Displays (dot/line plot, histograms, box plots) and Measures of Center (mean, median, mode, and range). The lab includes notes pages, examples with answer keys, and a final project in which the student can survey classmates and create a "flower" by using their data to find mean, median, mode, range. They will also create a box plot, histogram and dot plot.
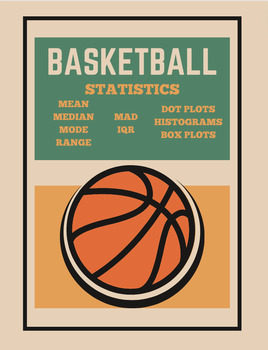
Basketball Statistics Project
Description: Engage your middle school students in the exciting world of basketball while reinforcing math and data analysis skills with this interactive Basketball Stats Project! This comprehensive resource is designed to captivate students' interest in both sports and mathematics, making learning both fun and meaningful.Take your students to the gym or outdoor playground hoop and they'll collect data on "How many baskets can ___ graders make in 60 seconds?" (the template is set to sixth grade
Subjects:
Grades:
5th - 8th
Types:
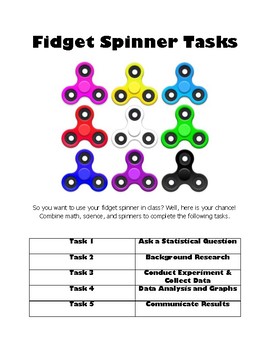
Fidget Spinner Tasks
This 5 part lesson combines math, science, and the fidget spinner craze! The five tasks incorporate 6th and 7th grade common core math standards in statistics and some geometry (area/circumference), along with the scientific method and writing.
Task 1: Ask a statistical question
-Includes identifying independent and controlled variables to design experiment fairly
Task 2: Background Research
-Includes drawing, describing qualities, calculating circumference and area of two circles, and weighing
Subjects:
Grades:
6th - 7th
Types:
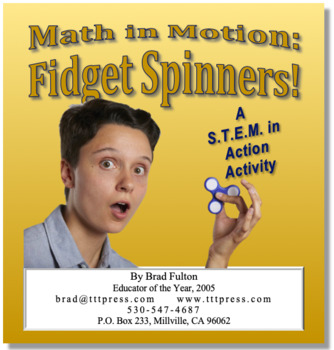
Fidget Spinners: Math in Motion
If a fidget spinner is better at holding a student’s interest than my math lesson, it’s not the fidget spinner than needs to go! Let’s use them to help the students see the math in their everyday life math in a fun and engaging way. Students will gather and interpret data, convert measurements of time, graph data, and even use online software if you wish.As a “S.T.E.M. in Action” lesson, you’ll find all four components of a true S.T.E.M. curriculum represented.Science — Students design an experi
Subjects:
Grades:
6th - 9th
Types:
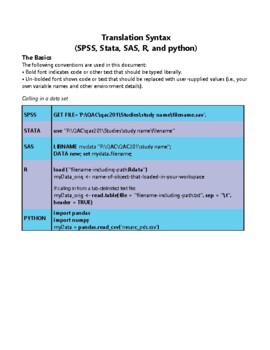
STATA software Secondary Data Analysis
This handout is intended for those interested in teaching/learning basic introductory statistics concepts to analyze real data. Students will learn how to tell a story using secondary data analysis. The handout is for STATA software and the US Longitudinal Study of Adolescent Health data set. For handouts on setting up an account, the data set code book and raw data file, a PowerPoint to accompany the handout, or questions please email kristin.flaming@gmail.com or ldierker@wesleyan.edu.This
Grades:
6th - 12th, Higher Education, Adult Education
Types:
Showing 1-5 of 5 results


