9 results
Common Core 7.SP.B.3 laboratories
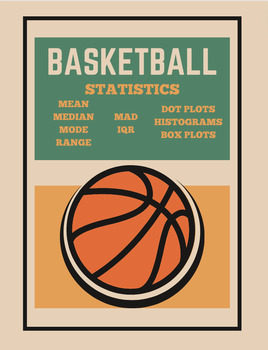
Basketball Statistics Project
Description: Engage your middle school students in the exciting world of basketball while reinforcing math and data analysis skills with this interactive Basketball Stats Project! This comprehensive resource is designed to captivate students' interest in both sports and mathematics, making learning both fun and meaningful.Take your students to the gym or outdoor playground hoop and they'll collect data on "How many baskets can ___ graders make in 60 seconds?" (the template is set to sixth grade
Subjects:
Grades:
5th - 8th
Types:
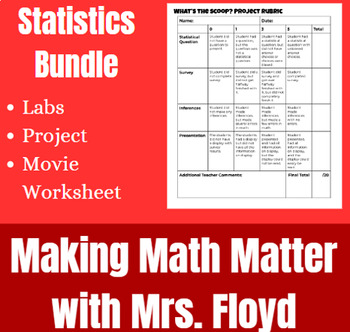
Statistics Activities Bundle
This bundle has 2 labs, 1 project, and a movie worksheet to Luca.
Subjects:
Grades:
6th - 10th
Types:
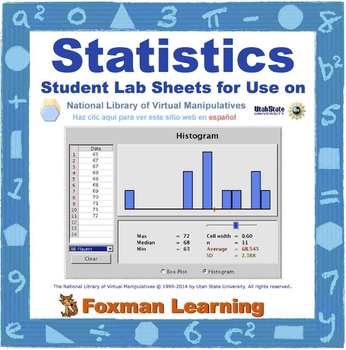
Statistics Graphs -- Virtual Manipulatives Lab for Middle School Math CCSS
This lab guides students through five of the statistics graphs virtual manipulatives (applets) from the nlvm website: Bar Chart, Pie Chart, Box Plot, Histogram, and Scatterplot. These virtual manipulatives are a great way for students to explore and compare various ways to represent data in a fun and conceptual format. My students really enjoy working through these labs and I enjoy the math understanding and discussions that follow. Five other nlvm labs for Middle School Math are available in M
Subjects:
Grades:
6th - 8th
Types:
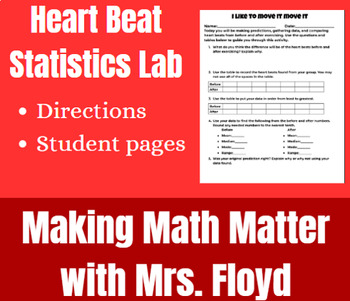
Heart Beat Statistics Lab
Students are comparing heart beats before and after exercising. This lab has students collecting, sorting, and comparing data.Included:Teacher page with description, materials needed, and directions.Student lab sheet
Subjects:
Grades:
6th - 10th
Types:
Also included in: Statistics Labs Bundle
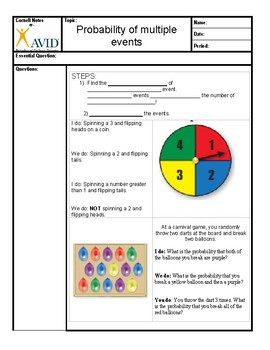
Bean Boozled Probability lab and Cornell Notes
This product is a lesson in probability using Bean Boozled. Buy the beans and let students calculate the probability of getting a yucky flavor! The Powerpoint presentation is to accompany is below.Bean Boozled Powerpoint PresentationBean Boozled Bundle
Subjects:
Grades:
5th - 8th
Also included in: Bean Boozled Probability Bundle
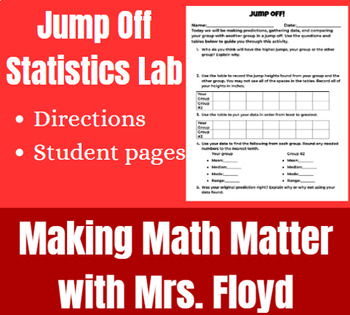
Jump Off Statistics Lab
Students are competing in groups to see which group can jump the highest. This lab has students collecting, sorting, and comparing data.Included:Teacher page with description, materials needed, and directions.Student lab sheet
Subjects:
Grades:
6th - 10th
Types:
Also included in: Statistics Labs Bundle
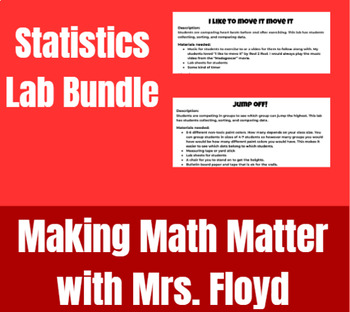
Statistics Labs Bundle
This bundle includes two statistics labs that have students up and moving to collect their data that they will then sort and compare.
Subjects:
Grades:
6th - 10th
Types:
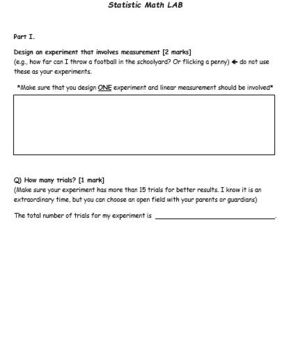
Statistic Math Lab (for Jr high math)
This is an activity-based statistic lab for grade 7, 8, or 9 statistics.The worksheet includes problems thatmainly focus on the following outcomes:1. Mean2. Median3. Mode4. RangeThis worksheet works best as a review activity near the end of the statistic unit.
Subjects:
Grades:
7th - 9th
Types:
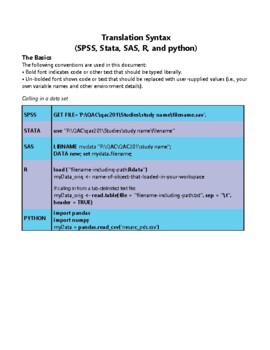
STATA software Secondary Data Analysis
This handout is intended for those interested in teaching/learning basic introductory statistics concepts to analyze real data. Students will learn how to tell a story using secondary data analysis. The handout is for STATA software and the US Longitudinal Study of Adolescent Health data set. For handouts on setting up an account, the data set code book and raw data file, a PowerPoint to accompany the handout, or questions please email kristin.flaming@gmail.com or ldierker@wesleyan.edu.This
Grades:
6th - 12th, Higher Education, Adult Education
Types:
Showing 1-9 of 9 results

