11 results
Common Core 7.SP.B.3 research
Pandemic Cross-Curricular Project (Coronavirus Distance Learning)
Items included in this resource (PDF and Editable):-Project Title Page-Table of Contents-PBL Letter from the CDC-Generic Overview of Project-Math Assignment (Crossed with Science)-Science Assignment (Crossed with Math, Social Studies, and ELA)-Social Studies Assignment (Cross with Math, Science, and ELA)-ELA (Crossed with Science and Social Studies)-Due Date Table (Rough and Final Drafts)-Help Session Table (Math, Science, Social Studies, ELA)-Rubrics (Math, Science, Social Studies, ELA)-Resourc
Subjects:
Grades:
5th - 9th
CCSS:
6 Editable Bar Graph Templates 2.0
Finally a simple and professional graph space that students can fill out without any design issues getting in the way. This file contains 6 ready-to-use graph options. Print them and have students fill them with pencil and ruler, or distribute them over computer and let them practice entering the data. Get a project perfect finish every time. Maybe you just want to fill it out live on a projector? The possibilities are endless! It's okay to say you love these bar graphs. So do we.Contains:- 2 bl
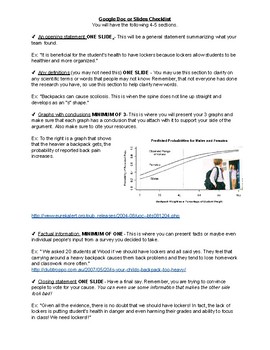
Statistics Debate Project
This is a final projects for students to do to end the statistic unit. It allows them to explore real life graphs and use them to build on their side of the argument. Students learn public speaking skills, powerpoint making skills, research skills, and how to read real like graphs.
Subjects:
Grades:
6th - 8th
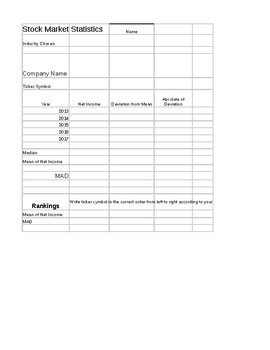
Stock Market Statistics Project
Students will use stocks of their choice to learn how the MAD can be used to calculate variability in the stock market. Students will also need to utilize their calculations in order to recommend a stock choice based on the parts of the project. They will write a letter of their stock choice to Warren Buffett using proper form describing their reasoning.
Subjects:
Grades:
7th
Types:
California Water Project
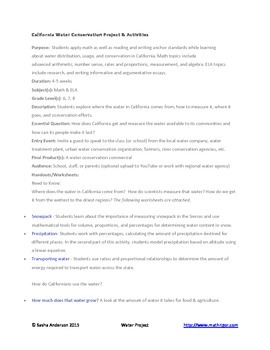
Students apply math as well as reading and writing anchor standards while learning about water distribution, usage, and conservation in California. Math topics include advanced arithmetic, number sense, rates and proportions, measurement, and algebra. ELA topics include research in addition to writing informative and argumentative essays. Sandra Kaplan's Depth and Complexity icons are identified.
Subjects:
Grades:
6th - 9th
Types:
Passion-Driven Statistics E-book (Introductory/AP Statistics Course Textbook)
Passion-Driven Statistics is an NSF-funded, multidisciplinary, project-based curriculum that supports students in conducting data-driven research, asking original questions, and communicating methods and results using the language of statistics. The curriculum supports students to work with existing data covering psychology, health, earth science, government, business, education, biology, ecology and more. From existing data, students are able to pose questions of personal interest and then use
Subjects:
Grades:
6th - 12th, Higher Education, Adult Education
Types:
SPSS software Secondary Data Analysis Workshop (Introductory/AP Statistics)
This handout is intended for those interested in teaching/learning basic introductory statistics concepts to analyze real data. Students will learn how to tell a story using secondary data analysis. The handout is for SPSS and the US Longitudinal Study of Adolescent Health data set. For handouts on the data set code book and raw data file, a PowerPoint to accompany the handout, or questions please email kristin.flaming@gmail.com or ldierker@wesleyan.edu.This handout was developed as a condensed
Subjects:
Grades:
6th - 12th, Higher Education, Adult Education
Types:
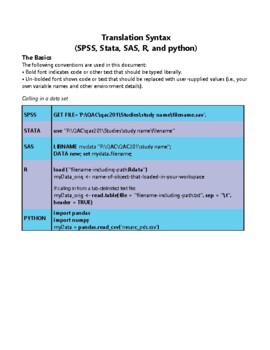
Translation Code
As part of our NSF-funded passion-driven statistics project, we have just started to share more widely our “translation code” aimed at supporting folks in learning code-based software and in moving more easily between them. The pdf includes all of the basic syntax for managing, displaying and analyzing data, translated across SAS, R, Python, Stata and SPSS. http://bit.ly/PDSTranslationCode.For more information about our warm and welcoming data-driven curriculum, check out https://passiondrivenst
Grades:
6th - 12th, Higher Education, Adult Education
Types:
STATA software Secondary Data Analysis
This handout is intended for those interested in teaching/learning basic introductory statistics concepts to analyze real data. Students will learn how to tell a story using secondary data analysis. The handout is for STATA software and the US Longitudinal Study of Adolescent Health data set. For handouts on setting up an account, the data set code book and raw data file, a PowerPoint to accompany the handout, or questions please email kristin.flaming@gmail.com or ldierker@wesleyan.edu.This
Grades:
6th - 12th, Higher Education, Adult Education
Types:
SAS software Secondary Data Analysis Workshop (Introductory/AP Statistics)
This handout is intended for those interested in teaching/learning basic introductory statistics concepts to analyze real data. Students will learn how to tell a story using secondary data analysis. The handout is for SAS (email for R, SPSS, Stata, & Python), a free cloud based system and the US Longitudinal Study of Adolescent Health data set. For handouts on setting up a free SAS account, the data set code book and raw data file, a PowerPoint to accompany the handout, or questions please e
Grades:
6th - 12th, Higher Education, Adult Education
Types:
R software Secondary Data Analysis Workshop (Introductory/AP Statistics)
This handout is intended for those interested in teaching/learning basic introductory statistics concepts to analyze real data. Students will learn how to tell a story using secondary data analysis. The handout is for R or R Studio, a free cloud based system and the US Longitudinal Study of Adolescent Health data set. For handouts on setting up a free R account, the data set code book and raw data file, a PowerPoint to accompany the handout, or questions please email kristin.flaming@gmail.com or
Subjects:
Grades:
6th - 12th, Higher Education, Adult Education
Types:
Showing 1-11 of 11 results

