7 results
Preschool Common Core 3.MD.B.3 games
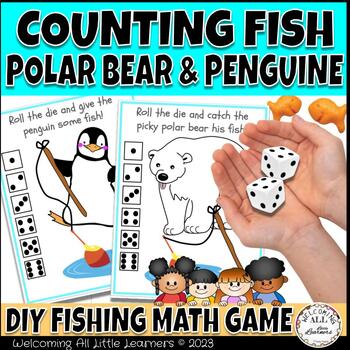
Tactile Penguin & Polar Bear Fishing Number Math Game: Counting, Dice, Graphing
Thank you for viewing this product!ABOUT THIS PRODUCT:This is a simple number recognition and counting math game that provides accommodate game sheets for penguin and polar bear math. These worksheets including rolling a die, locating a number, counting out goldfish, fishing with a DIY pole, and graphing the number found on a polar bear or penguin math sheet. This can be completed independently or in groups as a competition with the option to win a paper penguin or polar bear reward with their n
Subjects:
Grades:
PreK - 2nd
Types:
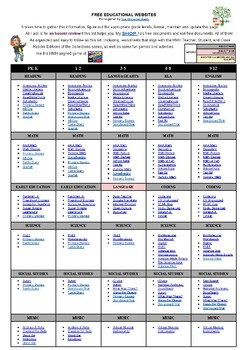
FREE EDUCATIONAL WEBSITES LIST 4 ALL GRADES K-12 AND SUBJECTS + TEACHER RESOURCE
Sometimes, you just need a list of websites for everyone. Here it is. FREE EDUCATIONAL WEBSITES Put together by Teach Me, Maria!It takes time to gather this information, figure out the appropriate grade levels, and format, maintain, and update this page. All I ask is for an honest review if this list helps you.
Subjects:
Grades:
PreK - 12th, Staff
Types:
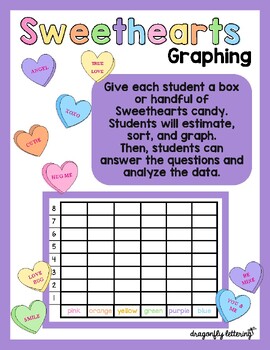
Sweethearts Candy Graph - Bar Graph, Line Plot, Picture Graph, Estimations
Estimating and Graphing Sweethearts CandyThis is a great Valentine's Day activity!Give each student a box or cupful of Sweethearts Candy to sort, graph, and analyze the data.Use these No PREP templates to create an academic-focused Valentine's Day project!Students will love that it involves candy and you will love that it involves math!This file includes:Estimations/Results Worksheet 4 graphing templates - differentiated questioning - one geared towards younger grades and one geared towards olde
Subjects:
Grades:
PreK - 8th
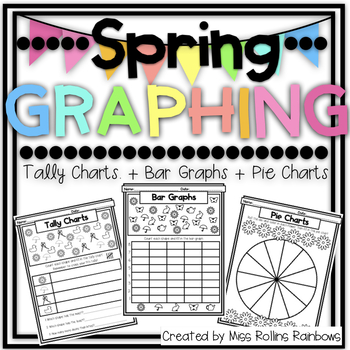
Spring Graphing! {Bar Graphs, Tally Charts, Pie Charts}
Spring themed bar graphs, tally charts and pie charts/ pie graphs. (Includes Easter and non-Easter themed pages)This set includes options forcount and graphmake your own graph roll and graphinterpreting data Easily differentiate to meet the needs of each of your students with this graphing set. Students can work independently, with partners or in groups. This resource can also be used as an exit ticket/ assessment.
Grades:
PreK - 5th
Types:
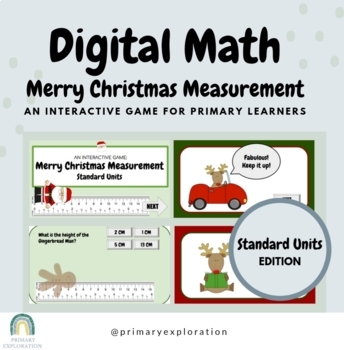
Christmas Measurement Game about STANDARD units {Google Slides/Google Classroom}
Merry Christmas Measurement: Interactive Game about STANDARD units is designed for Primary Learners. This Interactive Measuring Math Game can easily be applied to your Google Classroom, Digital Math Program, Math Centers, Distanced Learning Program and more. Students will have fun measuring and counting with standard units by using a virtual ruler. In this game, students will measure various Christmas themed items and select the correct measurement. You can use this as a whole group class lesson
Grades:
PreK - 3rd
Types:
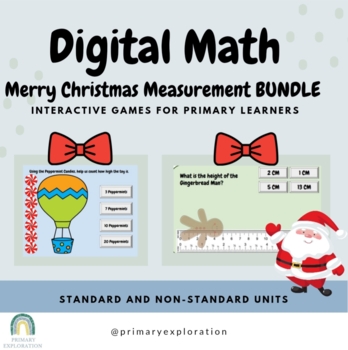
Christmas Measurement Games BUNDLE: Standard & Non-Standard Units- Google Slides
Christmas Measurement Interactive Games BUNDLE: Standard & Non-Standard Units allows you to BUNDLE and SAVE on TWO fantastic Interactive Measurement Games. Both games were designed for Primary Learners. Each game highlights a different method of measuring - using non-standard units, and standard units.1) Merry Christmas Measurement: Interactive Game about STANDARD units is designed for Primary Learners. Students will have fun measuring and counting with standard units by using a virtual rule
Grades:
PreK - 7th
Types:
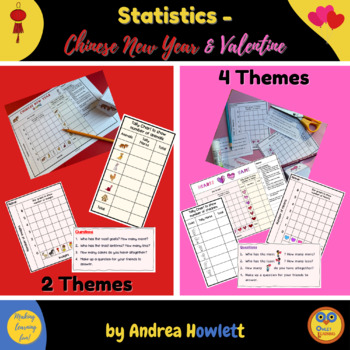
Mathematics - Early Statistics for Chinese New Year & Valentine
What is a bar graph or tally chart? These resources will generate fun for math games and give students opportunities to create data, draw a statistics graph and then answer questions using this information. They are encouraged to make up their own questions for their peers, thereby learning how to interpret a statistics graph and data collection. The cute clipart and competitive element - as this is a 'race to get to the top' - will keep them engaged and motivated to see who will win.This will h
Subjects:
Grades:
PreK - 1st
Types:
Showing 1-7 of 7 results

