39 results
Common Core HSS-ID.A.1 activities $5-10
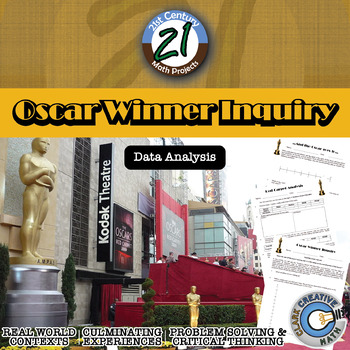
Oscar Winner -- Data Analysis & Statistics Inquiry - 21st Century Math Project
Utilize the last twenty years of Oscar winners as a data set to guide your students through creating box and whisker plots, histograms, and exploring mean, median, and mode -- in one 21st Century Math Project!Does the age of the award winning star in a film relate to the overall gross of the movie? Student will explore this inquiry question and use the data to support their conclusion.In this 8 page document you will be given a mapping to the Content Standards, an outline for how to implement t
Subjects:
Grades:
6th - 12th
Types:
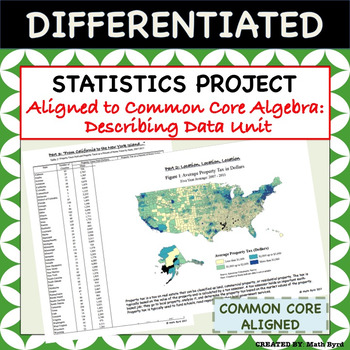
Statistics Project - Aligned to Common Core Algebra - Describing Data Unit
This differentiated U.S. Home Energy & Tax Themed Statistics Project covers all of the "describing data" standards of the Common Core Algebra Course using real data! Students will analyze various forms of tables & graphics to make inferences and interpret the data. The project is perfect for use as a summative assessment since students are required to justify their findings in open-ended format. Allow students to work in pairs, small groups, or individually! A grading rubric and selected
Subjects:
Grades:
8th - 11th
Types:
CCSS:
Also included in: Common Core Algebra 1 PROJECTS - BUNDLE PRICE!
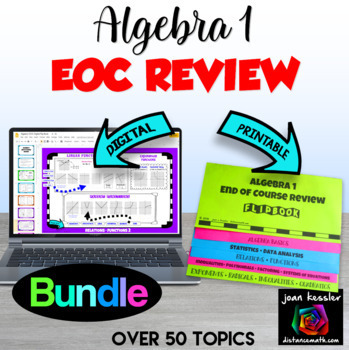
Algebra 1 End of Year Review Packet Print and Digital
I have bundled both the printable, foldable Algebra 1 EOC Review Packet Flip Book, with the Paperless, Digital Version of the Algebra 1 EOC Review for Google Slides™. The printable resource includes four versions of the book to meet your classroom needs, and the digital contains 13 interactive slides with fill-ins and matching. Choose the slides to include to customize for your students. Both come with full directions and answer keys. Please look closely at the individual previews and descri
Subjects:
Grades:
7th - 10th
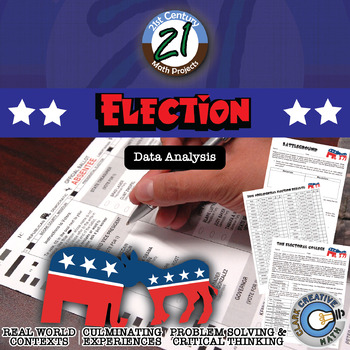
Election -- Political Science Data Analysis - 21st Century Math Project
Bring the 2020 Election into your classroom with a few authentic challenges that will push your students citizenship and build Election vocabulary across contents in this 21st Century Math Project! Students will use their skills with percents and data analysis to solve authentic election problems. In this 18 page document you will be given a mapping to the Content Standards, an outline for how to implement the project, handout resources for students to use, and an answer key. ***THIS PRODUCT HAS
Subjects:
Grades:
7th - 12th
Types:
CCSS:
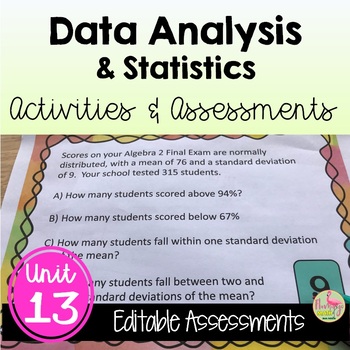
Data Analysis Activities and Assessments (Algebra 2 - Unit 13)
Data Analysis & Statistics Activity and Assessment Bundle:This resource is a bundled set of content quizzes, mid-unit quizzes, reviews, a station activity and two unit tests, both short response and multiple choice style. All keys are included in the unit bundle on Data Analysis & Statistics. The unit is designed to cover the material in-depth and to challenge your Algebra 2 Honors students.Additional Practice Assignments or Homework:6 Daily Quizzes (two forms each day)☑ Measures of Cent
Subjects:
Grades:
8th - 11th, Higher Education
Types:
CCSS:
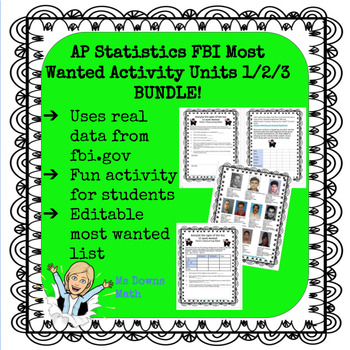
FBI Most Wanted AP Stat - Analyze Data, Normal Distributions, Linear Regression
I have created a series of activities for several units in the AP Statistics curriculum. The students love using data from fbi.gov to review concepts. This activity involves analyzing data related to the top 10 most wanted fugitives. I created this activity in May of 2020 and used the top 10 at that time. In the folder, you will find an editable slide of the top 10 if you want to change it.The answer key for the unit is based on the original top 10 that I used. Teachers have the option of having
Subjects:
Grades:
10th - 12th
Types:
CCSS:
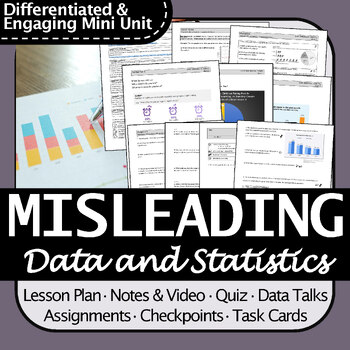
Misleading Data Mini Unit for Math 9 BC - Data Talks, Notes, Tasks, Review, Quiz
Mini unit in Statistics with warm up, data talks, scaffolded notes (with video), group task cards, worksheet assignment, checkpoint, and a quiz.Students learn:Read and interpret different types of graphs (circle graphs, bar graphs, line graphs, pictographs)Identify and critique data that is represented in a misleading way Includes:Authentic and recent data wherever possible (sources linked)3 sets of data talks that connect to the lesson and have authentic stats.Comprehensive and visual scaffolde
Subjects:
Grades:
6th - 11th
Types:
CCSS:
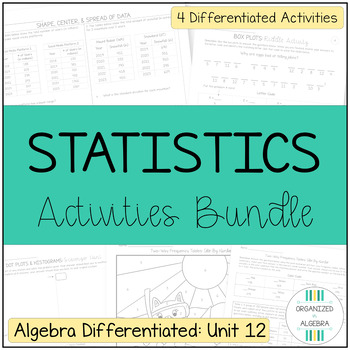
Statistics Differentiated Activity Bundle
Creating resources to meet the needs of ALL your students takes TIME! This activity bundle includes 4 differentiated, highly engaging activities for statistics so you can get hours back in your day and still meet their needs!These resources can save you the time and effort of creating additional versions of activities to meet your students' needs. It's done for you!Each activity comes with multiple versions and built-in differentiation options to meet the needs of your students. Click each activ
Grades:
9th - 10th
Types:
CCSS:
Fun with Ratios Activities Bundle - 7th Grade PBL with Math
The purpose of the Fun with Ratios Activities Bundle is to give students the opportunity to use creativity to apply ratios, proportions, and percentages in real-world settings. This bundle includes three unique tasks: Black Friday Mastery Task, Direct Variation Poster Mastery Task, and the Unique Survey Project. These activities and their accompanying materials are suited for students in grades 7 through 9. These lessons make excellent sub plans. Each project takes approximately two 60-minute bl
Subjects:
Grades:
7th - 9th
Types:
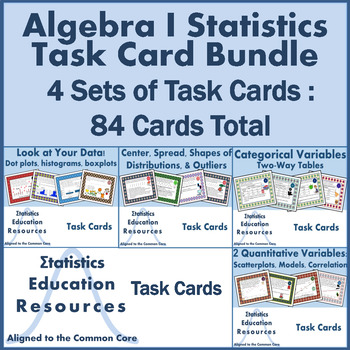
Bundle Task Cards Statistics Algebra I (84 Cards) (Common Core Aligned)
Algebra I Statistics Task Card Bundle (84 Cards) (Common Core Aligned) This product is a bundle that includes 4 sets of Common Core-Aligned task cards (84 cards total) each with a recording sheet and answer key. These task cards only require two cuts per page! The sets of task cards can also be purchased a la carte. Bundle Bonuses: We’re offering the bundle at a discount of almost 25% off of the a la carte price.That’s purchasing 3 sets of task cards and getting the 4th set free! Algebra I Sta
Subjects:
Grades:
8th - 12th
Types:
CCSS:
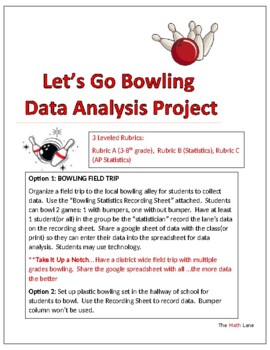
Let's Go Bowling Statistics STEM Project & Field Trip (3-12 and AP Stat)
Great END OF YEAR project. Get ready to strike up some fun with your students on a field trip to the bowling alley or right in your own hallway with a plastic bowling set! This isn't just any ordinary field trip - it's a real-world data collection extravaganza. 3 different leveled rubrics (Grade 4-10, Statistics, AP Statistics) so students can analyze the data based on their math knowledge. Students will be able to practice creating and analyzing graphical displays, scatterplots, construct c
Subjects:
Grades:
Not Grade Specific
Types:
Also included in: High School Statistics Project Bundle
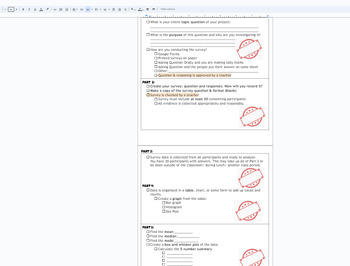
Statistics Survey project Discovery (broken down into sections) with Rubric
This is a broken down (scaffolded) packet of instructions/ guide for a Stats Project for Math 1 HS or 8th grade students. The goal of the project is for students to take a statistical survey on quantitative data (numbers) of their choice. Using this data from the survey, the following will be included in the project:Survey- the question being askedSurvey responses (requirement of 30)Data organization: Bar chart, Histogram, Dot PlotMeanMedianModeBox and Whisket Plot5 number summary (Q1,Q2,Q3, min
Subjects:
Grades:
7th - 12th, Higher Education, Adult Education
CCSS:
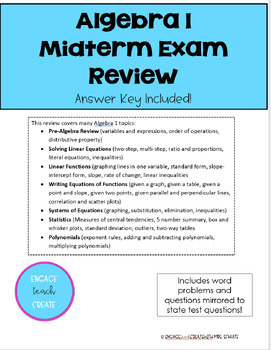
Algebra 1 - Mid-Term Exam Review with Key
This review covers many Algebra 1 topics: · Pre-Algebra Review (variables and expressions, order of operations, distributive property) · Solving Linear Equations (two-step, multi-step, ratio and proportions, literal equations, inequalities) · Linear Functions (graphing lines in one variable, standard form, slope-intercept form, slope, rate of change, linear inequalities· Writing Equations of Functions (given a graph, given a table, given a point and slope, given two points, given parallel and pe
Subjects:
Grades:
8th - 11th
Types:
CCSS:
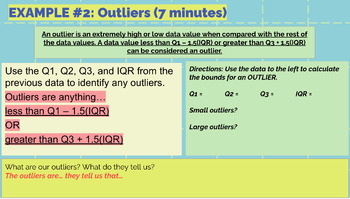
Lesson 2 PPT: One-Variable Data: Box Plots, Measures of Center and Variability
Hi! This is Part 2 of the lessons for One Variable Data for High School Statistics. Part 1 can be found on my product listings in my store. This lesson covers measures of central tendency (mean, median, mode), measures of variability (range, standard deviation, IQR), and how to create box plots. It includes guided practice during the lesson and think-write-pair-shares for students to engage in during the lesson.It's best downloaded into Google Drive and edited as you need for your class. If you
Subjects:
Grades:
10th - 12th
Types:
CCSS:
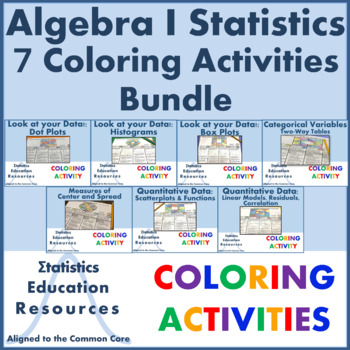
Bundle: Algebra I Statistics Coloring Activities (7 Activities) (Common Core)
This bundle includes 7 self-checking coloring worksheets on statistics—112 statistics problems total! Students practice solving problems on measurement, count, quantitative, and categorical data in these coloring activities. Students use both computation and contextual interpretation to solve problems. For each activity, students are given an answer bank and can self-check their work if their answer is not in the bank.This fun twist on worksheets engages students by allowing them to choose their
Subjects:
Grades:
8th - 11th
Types:
CCSS:
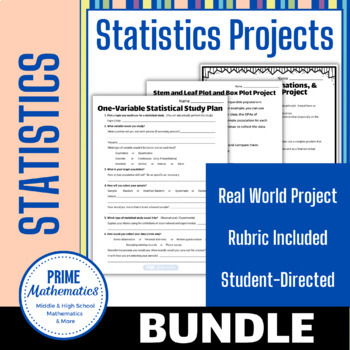
Statistics Projects BUNDLE
This growing bundle gives access to all of my Statistics Projects. These projects have students put their knowledge of statistics and probability to use. Get it now while it is still growing for the best price. The following topics will be added:Binomial Distribution ProjectTwo Sample Test Project
Subjects:
Grades:
9th - 12th
Types:
CCSS:
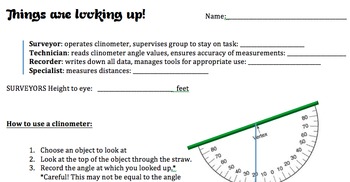
Angle of Elevation Activity
This is an activity for teachers looking to do a real life activity on angles of elevation or angles of depression. Students learn how to use clinometers and calculate the height of something tall using trigonometry. There is also an extension for teachers to use introducing statistics and box and whisker plots (by hand and using a TI-83 or TI-84 graphing calculator).
Comes with teachers instructions and student packet. PDF and Word document are included in the zip file.
Subjects:
Grades:
8th - 11th
Types:
CCSS:
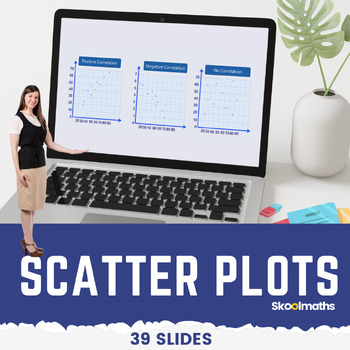
Eight Grade Scatter Plots Digital Math Lesson and Activities CCSS 8.SP.A.1
Eight Grade Scatter Plots Digital Math Lesson and ActivitiesTeach your high school grade how to use and interpret scatter graphs; recognize correlation; draw and use lines of best fit to make predictions?In this lesson, learners will be able to:use and interpret scatter graphs of bivariate data;recognize different types of correlation;draw estimated lines of best fit; anduse lines of best fit to make predictions.
Subjects:
Grades:
8th - 10th, Staff
Types:
CCSS:

Illustrative Mathematics Algebra 1 Unit 1 Standards Aligned Materials
This bundle includes interventions for the ID.A.1, ID.A.2, and ID.A.3 standards. It also aligns with the Illustrative Mathematics Algebra Curriculum. This would be a great resource to use prior to the end of unit 1 assessment or for reteaching purposes.
Grades:
8th - 11th
Types:
CCSS:
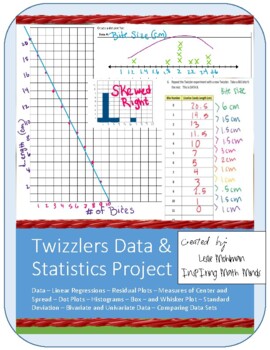
Twizzlers Data and Statistics Project in 5 Parts
In this project, students collect data, create graphs: scatterplots, dot plots, histograms, box-and-whisker plots. They analyze bivariate data by drawing lines of best fit, finding the correlation coefficient, linear regressions, and residual plots. They analyze univariate data looking at its shape (symmetric or skewed) and calculating the appropriate centers and spreads. With this fast and easy method of data collection, students each get their own data and most students will get one set of d
Subjects:
Grades:
7th - 12th
Types:
CCSS:
Also included in: Bundle: Data and Statistics Unit and Twizzlers Project
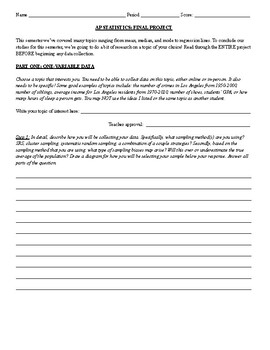
AP Statistics Project: Normal Distributions, Regression Analysis, and Sampling
If you are looking for a cumulative project that summarizes the three topics relating to: one-variable data analysis, two-variable data analysis, and sampling methods, this is a great project to provide to your regular or AP Statistics students. Topics covered in this project include normal distributions, scatterplots, correlation, regression analysis, sampling methods, sampling biases, and statistical thinking. It covers Unit 1, Unit 2, and Unit 3 materials in the AP Statistics suggested course
Subjects:
Grades:
11th - 12th
Types:
CCSS:
Also included in: AP Statistics / High School Statistics Projects
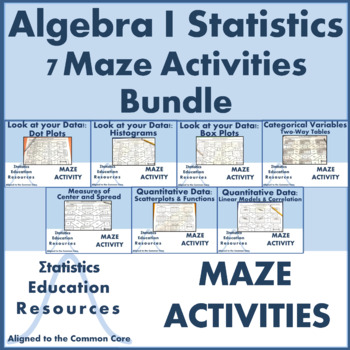
Bundle: Algebra I Statistics Maze Activities (7 Activities) (Common Core)
This bundle includes 7 self-checking maze worksheets on statistics. Students practice solving problems on measurement, count, quantitative, and categorical data in these maze activities. Students use both computation and contextual interpretation to solve problems. Students follow a maze to the finish line by correctly answering the questions. Possible paths provide an answer bank and an opportunity for self-checking. This fun twist on worksheets engages students by allowing them to independentl
Subjects:
Grades:
8th - 11th
Types:
CCSS:
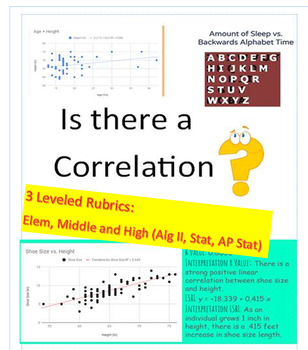
Correlation? Data Project (3 Rubrics_Elem/Middle School/ AP Stats) EOY
Get ready to supercharge your students' data analysis skills with this dynamic project! Perfect for end of year or semester project. In this engaging activity, students will have the exciting opportunity to collect their own data through surveys, online research, or real world data sets. They will then dive deep into the world of statistics as they determine if there is a correlation between two variables. With three different leveled rubrics, this project is perfect for students of all ages an
Subjects:
Grades:
Not Grade Specific
Types:
CCSS:
Also included in: High School Math Projects (Algebra II and Statistics) STEM No prep
Histogram & Line Plots - EDITABLE Slides, INB & Tests+++ Drive Math
Drive Instruction with instructional resources that live in the cloud on Google Drive! All of the docs are COMPLETELY EDITABLE and can be differentiated to meet your needs or the needs of your students. PDFs are also included in the download if you prefer them that way. Each Drive Instruction set includes warm-ups, exit tickets, notes, presentations, digital interactive notebooks and tests. These are designed to be complementary to all of my innovative supplemental resources and an improvement o
Subjects:
Grades:
6th - 9th
CCSS:
Also included in: Complete Pre-Algebra - EDITABLE Slides / INB/ Warm-Ups / Notes / Test+++
Showing 1-24 of 39 results

