Election -- Political Science Data Analysis - 21st Century Math Project
- Zip
- Google Apps™

Also included in
- The project is the core of what I have built my classroom around. Scaffolding learners to real world projects. This bundle includes the 105+ math projects I have written. This is over 2,700 pages of content.21st Century Math Projects each scaffold through an authentic context and math skill buildingPrice $395.00Original Price $564.00Save $169.00
- This is a selection of my Measures of Center & Variance resources all in a money saving Essential Bundle! You save significant money and time versus purchasing these separately!Essential Bundles are designed to give you everything you need to rock your unit. Warmups, Notes, Activities, Games, ExPrice $35.00Original Price $98.00Save $63.00
- This is a selection of my Data Displays & Analysis resources all in a money saving Essential Bundle! You save significant money and time versus purchasing these separately!Essential Bundles are designed to give you everything you need to rock your unit. Warmups, Notes, Activities, Games, Exit TiPrice $35.00Original Price $146.50Save $111.50
- This is a selection of my Percent resources all in a money saving Essential Bundle! You save significant money and time versus purchasing these separately!Essential Bundles are designed to give you everything you need to rock your unit. Warmups, Notes, Activities, Games, Exit Tickets, and Tests. YouPrice $35.00Original Price $139.00Save $104.00
Description
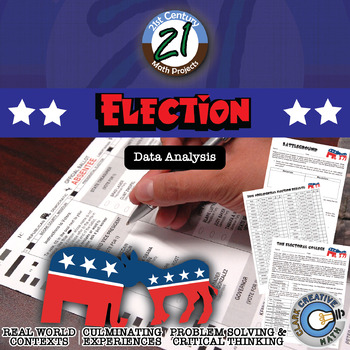
Bring the 2020 Election into your classroom with a few authentic challenges that will push your students citizenship and build Election vocabulary across contents in this 21st Century Math Project!
Students will use their skills with percents and data analysis to solve authentic election problems.
In this 18 page document you will be given a mapping to the Content Standards, an outline for how to implement the project, handout resources for students to use, and an answer key. ***THIS PRODUCT HAS BEEN UPDATED WITH A GOOGLE SLIDES INTERACTIVE VERSION INCLUDED. REDOWNLOAD IF YOU HAVE IT ALREADY***
In all it is two different assignments --
-- "Battleground States" -- students will analyze tables and graphs of recent Presidential Election to understand the difference between "safe" states, "battleground" states and the differences in funding and campaign stops between them. Why exactly does Obama and Romney practically live in Ohio and Florida? Students will discover this for themselves.
-- "The Electoral College" -- students use a hypothetical Alternative Method to decide the President! Many take issue with the Electoral College so students will compare the actual results with the Alternative to see if there is any difference in who would have been President!
You may be interested in the following discounted bundles. SAVE $$$!
•21st Century Math Projects -- All the Projects
Need an Entire Curriculum?
•21st Century Pre-Algebra –- the Entire Curriculum
For more tips, tricks and ideas check out the Clark Creative Education Blog
And join our community where I post ideas, anecdotes, elaborations & every once in a while I pass out TPT gift cards! And jokes! I do jokes too!


