
Statistics Project - Aligned to Common Core Algebra - Describing Data Unit


- PDF
Also included in
 This Common Core Algebra 1 Differentiated Project Bundle includes 4 real-world projects:1) Linear Equations Project: "Algebra in the Medical Field"2) Quadratic Function Project: "Outer Spaced Themed - Science Based Mathematics"3) Exponential Equations Project: "Algebra in Earth Science"4) StatisticsPrice $18.31Original Price $26.15Save $7.84
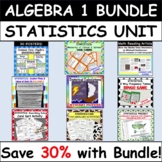 This Statistics Unit Bundle set includes a wide variety of 10 resources all geared towards the Common Core Algebra 1 course.Resources Included:Culminating Project Based on Real World Data30 PostersCard Sort ActivityMath Reading Article & Follow Up SummaryTask Cards ActivityFoldableMystery ColorPrice $36.33Original Price $51.90Save $15.57
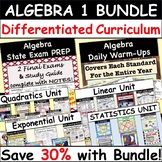 The Common Core Algebra 1: Curriculum Set includes 59 differentiated resources and learning activities designed to engage students. The curriculum set is aligned to the Common Core standards which are outlined in the lesson plans for each resource. The Ultimate package for projects, vocabulary activPrice $213.36Original Price $304.80Save $91.44
Description
This differentiated U.S. Home Energy & Tax Themed Statistics Project covers all of the "describing data" standards of the Common Core Algebra Course using real data! Students will analyze various forms of tables & graphics to make inferences and interpret the data. The project is perfect for use as a summative assessment since students are required to justify their findings in open-ended format. Allow students to work in pairs, small groups, or individually! A grading rubric and selected answer key is included.
Skills Used:
Determine Type of Graph that Best Represents Data Given
Build Histogram
Make Mathematical Observations & Associations Based on Evidence & Reasoning
Determine Type of Statistics that Can Be Found in Graphs
Calculate and Explain Measures of Center & Spread in the Context of the Data (including: range, IQR, MAD, mean, median, mode)
Describe Shapes of Graphs
Create Box Plots
Create a Survey, Collect Data, and Create a 2-Way Frequency Table
Find Joint, Marginal, and Conditional Frequencies
Convert 2-Way Frequency Table into 2-Way Relative Frequency Table
Create Scatter Plot & Line of Best Fit
Interpret Characteristics of a Linear Regression Function (including: intercepts, slope, correlation coefficient)
Make Predictions
Discuss Causation & Correlation
Differentiation:
This project has two tiers, one has more problems and greater depth. Separate answer keys and rubrics are included for each tier. Perfect for the inclusive classroom!
Common Core Standards:
CCSS.MATH.PRACTICE.MP1 Make sense of problems and persevere in solving them.
CCSS.MATH.PRACTICE.MP2 Reason abstractly and quantitatively.
CCSS.MATH.PRACTICE.MP3 Construct viable arguments and critique the reasoning of others
CCSS.MATH.PRACTICE.MP4 Model with mathematics.
CCSS.MATH.PRACTICE.MP5 Use appropriate tools strategically.
CCSS.MATH.PRACTICE.MP6 Attend to precision.
CCSS.HSS.ID.A.1 Represent data with plots on the real number line (dot plots, histograms, and box plots).
CCSS.HSS.ID.A.2 Use statistics appropriate to the shape of the data distribution to compare center and spread of two or more different data sets.
CCSS.HSS.ID.A.3 Interpret differences in shape, center, and spread in the context of the data sets, accounting for possible effects of extreme data points (outliers).
CCSS.HSS.ID.B.5 Summarize categorical data for two categories in two-way frequency tables. Interpret relative frequencies in the context of the data (including joint, marginal, and conditional relative frequencies). Recognize possible associations and trends in the data.
CCSS.HSS.ID.B.6 Represent data on two quantitative variables on a scatter plot, and describe how the variables are related.
CCSS.HSS.ID.B.6a Decide which type of function is most appropriate by observing graphed data, charted data, or by analysis of context to generate a viable function of best fit. Use this function to solve problems in context.
CCSS.HSS.ID.B.6c Using given or collected bivariate data, fit a linear function for a scatter plot that suggests a linear association.
CCSS.HSS.ID.C.7 Interpret the slope (rate of change) and the intercept (constant term) of a linear model in the context of the data.
CCSS.HSS.ID.C.8 Compute (using technology) and interpret the correlation coefficient “r” of a linear fit. (For instance, by looking at a scatterplot, students should be able to tell if the correlation coefficient is positive or negative and give a reasonable estimate of the “r” value.) After calculating the line of best fit using technology, students should be able to describe how strong the goodness of fit of the regression is, using “r”.
CCSS.HSS.ID.C.9 Distinguish between correlation and causation.
See similar resources:
Statistics: Representing and Interpreting Data(Box Plots, Histograms, Dot Plots) CARD SORT
Statistics: 2 Way Frequency Tables BINGO GAME
Statistics:Measures of Center and Spread TASK CARDS
Statistics: Scatter Plots and Lines of Best Fit FOLDABLE
Statistics: Math Reading Article (Case Studies of Really Bad Graphs Found in the Media)
Statistics: Vocabulary Activities
Statistics: Line of Best Fit MYSTERY ACTIVITY (FREE!)
This topic is also covered in:
Algebra State Exam Prep: Study Guide w/ Notes and 2 Practice Tests
Algebra Warm-ups/ Bellringers/ Exit Tickets- COMMON CORE ALIGNED
Algebra Curriculum Vocabulary Bundle: Matching Card Sets & Vocabulary Puzzles
Common Core Algebra 1 Full Curriculum POSTERS
*Purchase of this product provides one (1) purchaser the rights for solely personal classroom use. Posting any part of this publication on the Internet in any form, including classroom websites, is strictly prohibited and in violation of the Digital Millennium Copyright Act. To share this resource with colleagues, please purchase additional licenses. Inquire to mathbyrd@gmail.com for discounted multiple license purchases.
