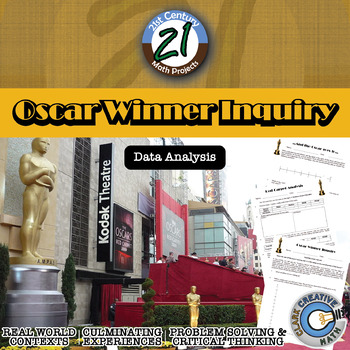
Oscar Winner -- Data Analysis & Statistics Inquiry - 21st Century Math Project
- Zip
- Google Apps™

What educators are saying
Also included in
- The project is the core of what I have built my classroom around. Scaffolding learners to real world projects. This bundle includes the 105+ math projects I have written. This is over 2,700 pages of content.21st Century Math Projects each scaffold through an authentic context and math skill buildingPrice $316.00Original Price $564.00Save $248.00
- This is a selection of my Measures of Center & Variance resources all in a money saving Essential Bundle! You save significant money and time versus purchasing these separately!Essential Bundles are designed to give you everything you need to rock your unit. Warmups, Notes, Activities, Games, ExPrice $28.00Original Price $98.00Save $70.00
- This is a selection of my Data Displays & Analysis resources all in a money saving Essential Bundle! You save significant money and time versus purchasing these separately!Essential Bundles are designed to give you everything you need to rock your unit. Warmups, Notes, Activities, Games, Exit TiPrice $28.00Original Price $146.50Save $118.50
- 12 of my best selling projects/units all in an organized money saving bundle! These engaging, student/teacher approved math projects that provide rigor, relevance, and cross-curricular content altogether. I have each of these projects advertised separately these projects are $70, so this is over 30%Price $36.00Original Price $70.00Save $34.00
Description
Utilize the last twenty years of Oscar winners as a data set to guide your students through creating box and whisker plots, histograms, and exploring mean, median, and mode -- in one 21st Century Math Project!
Does the age of the award winning star in a film relate to the overall gross of the movie? Student will explore this inquiry question and use the data to support their conclusion.
In this 8 page document you will be given a mapping to the Content Standards, an outline for how to implement the project, and handout resources for students to use. ***THIS PRODUCT HAS BEEN UPDATED WITH A GOOGLE SLIDES INTERACTIVE VERSION INCLUDED. REDOWNLOAD IF YOU HAVE IT ALREADY***
-- In "And the Oscar Goes to...", students will use Academy Award Winner Data to complete box and whisker plots. The focus of the task is on the age of the winners and students are attempting to answer if it is more likely for an older man or an older woman to win an Oscar.
-- In "Red Carpet Analysis" students will use Academy Award Winner Data to determine central tendency, construct stem and leaf plots, and construct histograms of different variables.
-- In "Oscar Winner Inquiry", student will use Academy Award Winner Data in an attempt to answer the question: “Does the age of the award winning star in a film relate to the overall gross of the movie?”
You may be interested in the following discounted bundles. SAVE $$$!
•21st Century Math Projects -- All the Projects
•Algebra Projects Starter Bundle
Need an Entire Curriculum?
•21st Century Pre-Algebra –- the Entire Curriculum
For more tips, tricks and ideas check out the Clark Creative Education Blog
And join our community where I post ideas, anecdotes, elaborations & every once in a while I pass out TPT gift cards! And jokes! I do jokes too!


