22 results
3rd grade statistics rubrics by TpT sellers for TpT sellers
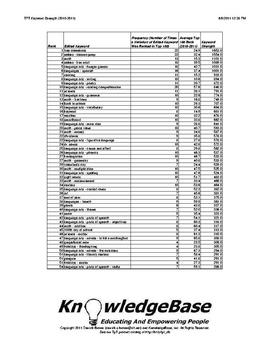
TPT KeyWord Strength Index (2010-2011) - Downloadable Spreadsheet!
What are the strongest keywords on TpT?
1. free downloads
2. Deanna Jump
3. math
Neither #1 nor #2 are surprises, but #3 (math) was certainly a surprise to me!
This report analyzes TpT's 2010-2011 keywords using a measure called "keyword strength".
The measure is based on a keyword's average rank, as well as the number of times it appeared in the 2010-2011 "Top 100" TpT search engine rankings.
This can be a valuable tool to help sellers understand TpT's marketplace supply and demand!
The P
Subjects:
Grades:
PreK - 12th, Higher Education, Adult Education, Staff
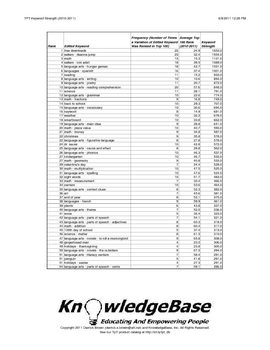
TPT KeyWord Strength Index (2010-2011) - Downloadable PDF!
What are the strongest keywords on TpT?
1. free downloads
2. Deanna Jump
3. math
Neither #1 nor #2 are surprises, but #3 (math) was certainly a surprise to me!
This report analyzes TpT's 2010-2011 keywords using a measure called "keyword strength".
The measure is based on a keyword's average rank, as well as the number of times it appeared in the 2010-2011 "Top 100" TpT search engine rankings.
This can be a valuable tool to help sellers understand TpT's marketplace supply and demand!
The P
Subjects:
Grades:
PreK - 12th, Higher Education, Adult Education, Staff
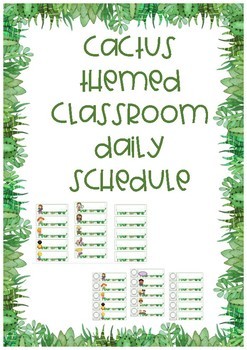
Cactus Themed Daily Schedule EDITABLE
Cactus Themed Daily ScheduleHave a daily timetable in your classroom that you can change each day and students know what is happening each day.In this pack you will get:*Schedule cards with clipart x5 to a page (35 different clipart)*Schedule cards without clipart x5 to a page (1 page included)*Schedule cards with clipart and clock x5 to a page (35 different clipart)*Schedule cards without clipart and clock x5 to a page (1 page included)*Heading "OUR SCHEDULE"*Heading "WHAT ARE WE DOING TODAY"
Subjects:
Grades:
PreK - 6th
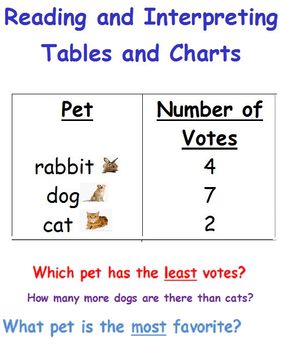
Reading a Table-Data and Statistics-First Grade
There are 4 different worksheets in which students can interpret the data of various tables. I hope they are of help to you! :)
Subjects:
Grades:
K - 3rd
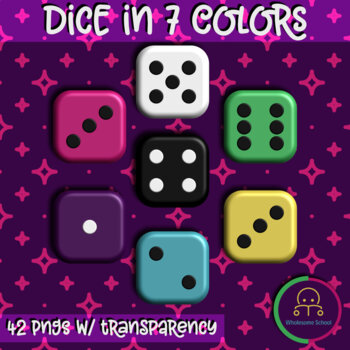
42 Dice in 7 Colors | PNG Transparency | Graphics for Math, Games, Statistics
Create fun activities for your students with these digital die images. Each dice has a 3D effect giving them a more realistic look as opposed to a flat design. (Please view the thumbnails and preview PDF.)Each die is 1000 x 1000 px PNG image with transparency (transparent background). You can add your own effects like drop shadows in whatever graphic design software you're using.What you'll get in the zip folder:7 folders (one for each color set)each folder has 6 images (die 1 - 6)License/Terms
Grades:
1st - 3rd, Not Grade Specific
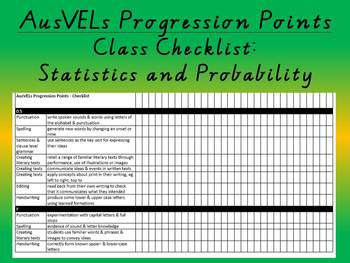
Statistics and Probability - AusVELs Progression Points - Class Checklist
AusVELs progression points for Statistics and Probability presented in a class checklist for primary levels. Great assessment tracker tool.
Subjects:
Grades:
K - 6th
Types:
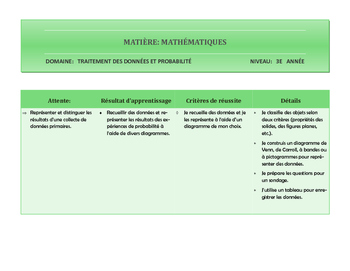
Résultats d'apprentissage et critères d'évaluation TDP 3e année
Ce document, conçu à l’intention des enseignant (e)s, comprend les résultats d’apprentissage et les critères de réussite (évaluation) avec des détails qui couvrent toutes les attentes du programme cadre de mathématiques de l’Ontario en traitement de données et probabilité.
Il est prêt à être utilisé tel quel ou il peut servir comme source d’inspiration pour les grilles d’évaluation adaptées, pour les tableaux en T, pour des situations d’apprentissage spécifiques selon les besoins des élèves, e
Subjects:
Grades:
3rd
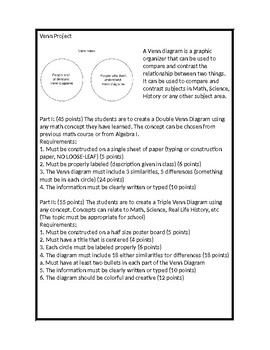
Venn Diagram Project
A Venn diagram is a graphic organizer that can be used to compare and contrast the relationship between two things. It can be used to compare and contrast subjects in Math, Science, History or any other subject area.
Subjects:
Grades:
3rd - 12th
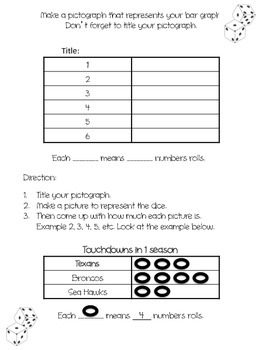
Make your Bar graph and Pictograph
This can be used for a station, practice, or part of your lesson.
Students role a dice to make their own graph and then turn it into a pictograph.
There is a graph for the dice, a pictograph table, with an example, and generic questions to go along with the students dice graph.
It covers TEKS 3.13A, 3.13B and 3.13C
If you want just the blank graph or pictograph, please message me or email me and I will send it to you!
Enjoy!
Make your own bar graph and pictograph by Patricia Freitag Fons
Subjects:
Grades:
2nd - 4th
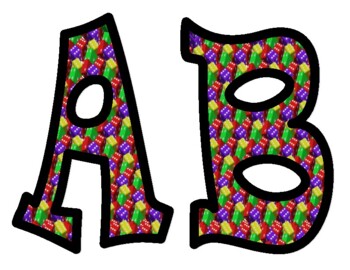
Dice Bulletin Board Letters
These dice themed alphabet letter will brighten up your bulletin board display. All 26 alphabet letters are included in an uppercase font, as well as numerals 0-9 and punctuation. Letters are approximately 6 inches tall. Just print what you need and enjoy. Be sure to check out my other fun, themed letters in my store.
Subjects:
Grades:
PreK - 12th, Higher Education, Adult Education, Staff
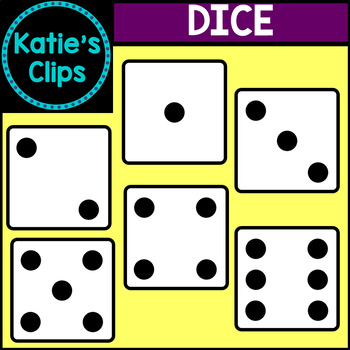
Dice Clipart
Included in this set are 6 dice images.
All images are in png format with transparent backgrounds so you can easily layer them into your projects.
This product is part of my Math Clipart Bundle where you can purchase the entire set of math clipart at a discount!
Subjects:
Grades:
PreK - 5th
Also included in: Math Clipart Bundle
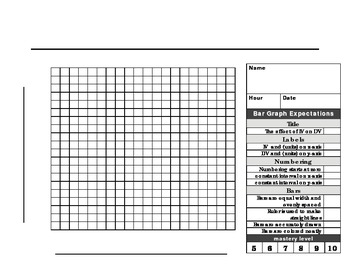
Bar Graph paper and rubric
This 20 X 20 graph paper with rubric is made for a beginner scientist to make a the perfect BAR graph. The checklist format makes it easy for students to know what is expected when graphing. Enjoy!
Subjects:
Grades:
1st - 12th, Higher Education, Adult Education
Types:

MedAware Labels and Chart Kit Booklet
Always Know When, What, Why and How Medications are taken.
(Avoid under and overdosing prescription, generic and other drugs).
Subjects:
Grades:
PreK - 12th, Higher Education, Adult Education, Staff
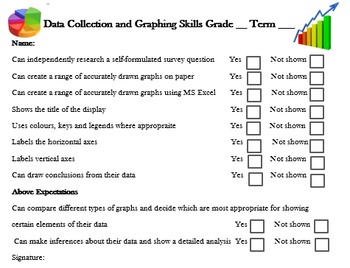
Graph and Data Assessment Checklist & Rubric
Short and quick-to-mark assessment rubric and checklist for graphing tasks suitable for students from grades 2 to 6.
You may also like:
-Comprehensive Multiplication Unit for free
- All Materials Maths units, just click on my store logo to view the full range.
Full set of Maths Assessments:
- Place Value Assessment
- Addition Assessment
- Subtraction Assessment
- Multiplication Assessment
- Division Assessment
- Fractions/Decimals Assessment
Subjects:
Grades:
2nd - 6th
Types:
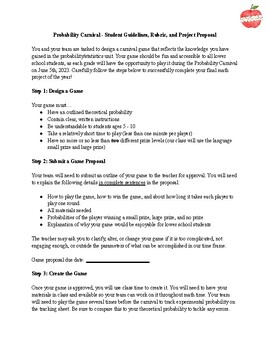
Probability Carnival Freebie
Students will dive into the core skills of probability by designing, creating, proposing, and reflecting upon a carnival game (a bloom's taxonomy dream)! Use and adapt this resource to fit the needs of your classroom to create a memorable learning experience. *Highlights: probability, statistics, graphing, project based learning, game design, teamwork, student-centered learningOptional inquiry-based learning essential question: How can we, as mathematicians, design and create an age appropriate
Subjects:
Grades:
3rd - 8th
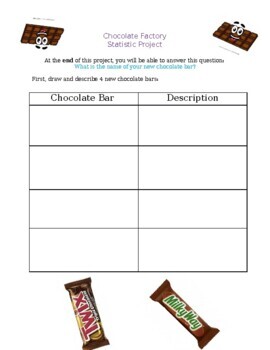
Chocolate Factory Statistics Project with Rubric
Chocolate Factory Statistics and Probability ProjectStudents are to come up with different chocolate bar designs and collect data on which is the most popular.At the end of the project, students can have a go at creating their chocolate bar packaging! Please see the store to see an additional, more comprehensive rubric.
Subjects:
Grades:
1st - 3rd
Types:
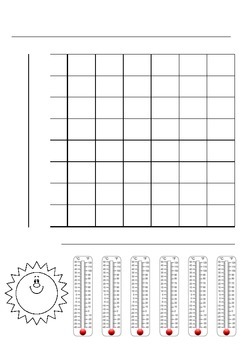
Graphing Temperature Worksheet
This is a great worksheet where children are required to collect the temperature each day and graph the results. Students will be required to label the different parts of the graph.
Subjects:
Grades:
2nd - 5th
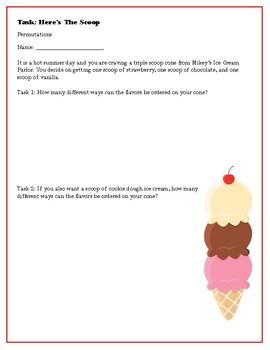
Permutation Task: Here's the Scoop
Use this task to teach about permutations. It is fun and will lead to a great discussion on different methods to deal with ordering a set of items.
Subjects:
Grades:
3rd - 8th
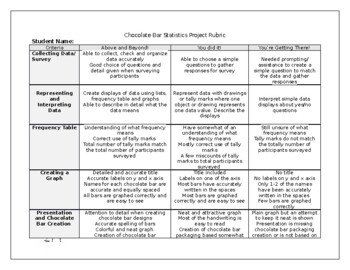
Chocolate Factory Statistics and Probability Project RUBRIC
An additional and more detailed rubric for the Chocolate Factory Statistics and Probability Project
Subjects:
Grades:
1st - 3rd
Types:
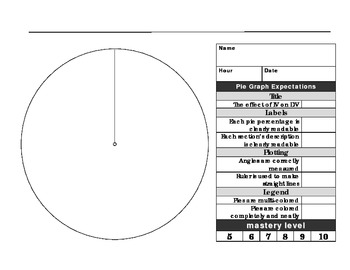
Pie Graph Paper and Rubric
This pie graph paper with rubric is made for a beginner scientist to make a the perfect PIE graph. The checklist format makes it easy for students to know what is expected when graphing. Enjoy!
Subjects:
Grades:
3rd - 12th, Higher Education
Types:
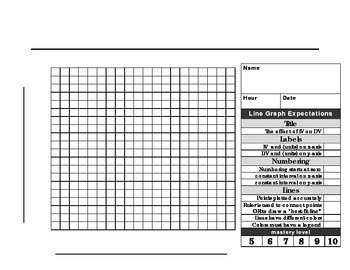
Line graph paper with rubric
This 20 X 20 graph paper with rubric is made for a beginner scientist to make a the perfect LINE graph. The checklist format makes it easy for students to know what is expected when graphing. Enjoy!
Subjects:
Grades:
3rd - 12th, Higher Education
Types:
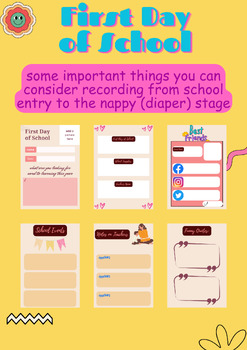
First Day of School
Remember that the key is to document things that feel significant to you and your child. These records will become cherished memories that you can look back on with fondness as your child grows up
Subjects:
Grades:
PreK - 9th
Showing 1-22 of 22 results


