10 results
Graphing lesson images
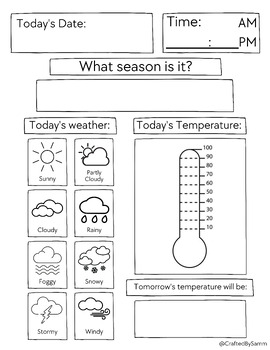
Today's Weather Worksheet
This worksheet is the perfect activity for your students to complete before jumping into your lesson on weather! Your students can track the date, time, season, weather, temperature and tomorrows weather! Perfect for Elementary or Special Education!Students will learn how to research the weather for tomorrow and use a thermometer to graph the temperature.You can either bring your students outside with this worksheet or pull up a weather website so they can use that as a reference!!
Subjects:
Grades:
2nd - 5th
Types:
Lucky Charm Bar Graph
With the use of real Lucky Charm Marshmallows, this activity is an excellent way to get in the Saint Patrick's Day spirit as well as teach bar graphs.
Subjects:
Grades:
2nd - 3rd
Types:
Also included in: Lucky Charm Bar Graphs and Fractions
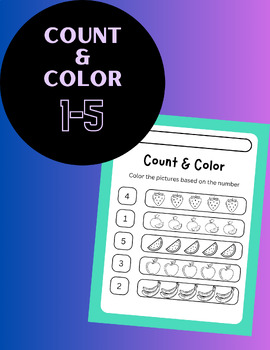
Count & Color 1-5
A fun way to teach your children to count!
Grades:
PreK - K
Also included in: Count & Color 2 pack
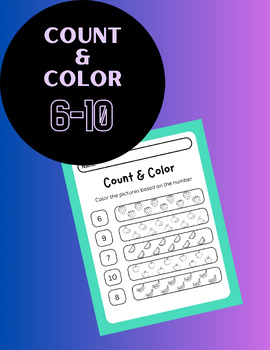
Count & Color 6-10
A fun way to make teaching your children how to count! 6-10!
Grades:
PreK - K
Also included in: Count & Color 2 pack
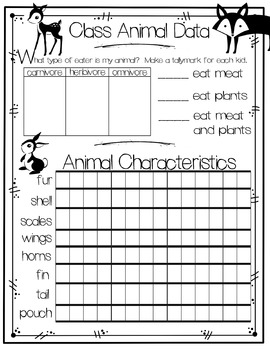
Animal Research Non Fiction Page Graphing / Data
Animal Research Non Fiction Page Graphing / Data
A fun way to incorporate data in their informational books!
Subjects:
Grades:
PreK - 4th
Types:
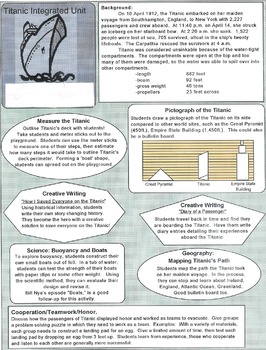
Titanic Unit Ideas-Distance Learning
Seven cross-curricular activities centered around the Titanic. Graphing, creative writing, science: buoyancy, geography, and an activity to build teamwork.
Subjects:
Grades:
4th - 6th
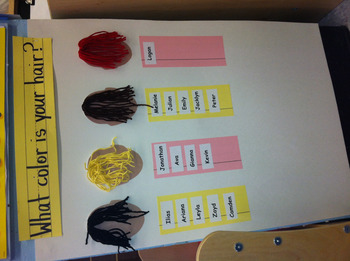
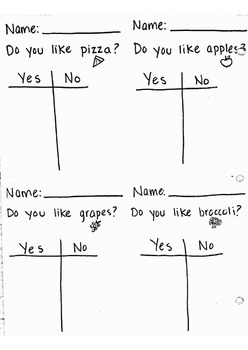
Tally Charts
Four tally charts for your students to use when learning about graphing, surveys, etc.
Subjects:
Grades:
PreK - 1st
Types:
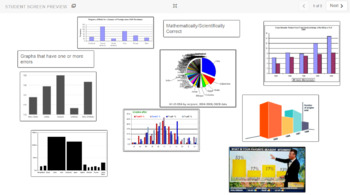
What makes a graph good? Desmos Teacher Lesson
This activity is a quick one where students do a card sort on Desmos teacher with graphs that are good or bad. After completing the card sort, they are asked to put their ideas into words and name characteristics of good and bad graphs.Here is the link to the activity:https://teacher.desmos.com/activitybuilder/custom/622f44d79332880a515aa8ac
Grades:
Not Grade Specific
Showing 1-10 of 10 results


