5 results
Common Core 3.MD.B.3 lessons for SMART Notebook

Bar Graphs & Pictographs for Measurement / Data for the SMART Board
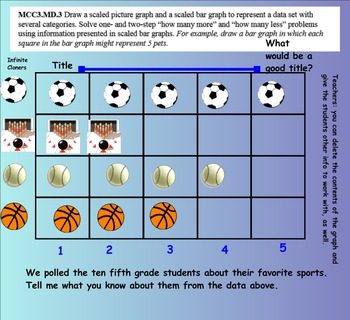
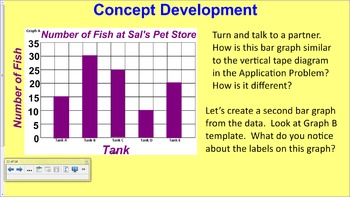
Bar Graphs & Pictographs for Measurement / Data for the SMART BoardIn this SMART Board Common Core Bar & Pictograph lesson, students will create and draw a scaled picture graph and a scaled bar graph to represent a data set with several categories. Solve one- and two-step “how many more” and “how many less” problems using information presented in scaled bar graphs. For example, draw a bar graph in which each square in the bar graph might represent 5 pets.This interactive SMART Board less
Subjects:
Grades:
2nd - 4th

Math GR 3 CCS Unit 4 Geometry, Line Plots, Area, & Perimeter
This is a Smart Board Unit of CCS involving geometry, line plots, area, and perimeter. It is 24 pages long. Four of the pages a pulled to assist you from the public website in GA for CCS. The remaining 20 are all interactive and a versatile so that you can add to and/or easily change numbers for extra skill drill. It also works on vocabulary since there is a great deal of it to learn in this unit.
It includes standards 1,3,4,7,and 8.
Susan
Subjects:
Grades:
3rd - 4th

Engage NY (Eureka) 3rd Grade Common Core Math Module 6-Topic A
If you love Engage NY, but are looking for a more engaging way to teach the modules, you have come to the right place! This notebook file for SmartBoard follows the 3rd grade Module 6-Topic A, Lessons 1 - 4. If you like these lessons, follow me for full topic notebooks for more topics, other modules and grade levels. Save time and energy while engaging students in common core math! These lessons cover generating and analyzing categorical data. Engage NY created the modules, I made them easi
Grades:
3rd
CCSS:

NY State Module 6 Graphing
This file follows all prompts and procedures (including fluency activities) for the modules posted by NY state to meet the Common Core standards. It is the 6th 3rd grade unit which covers 9 days of graphing. You will want to go to the website for Engage NY to obtain the related worksheets and assessments.
Grades:
3rd

Picture Graphs and Questions CCSS
In this SMART lesson, students will interpret picture graphs and answer math questions based on the graph.
3.MD.B.3 Draw a scaled picture graph and a scaled bar graph to represent a data set with several categories. Solve one- and two-step "how many more" and "how many less" problems using information presented in scaled bar graphs
Subjects:
Grades:
2nd - 4th
Showing 1-5 of 5 results

