54 results
6th grade graphing lecture microsofts
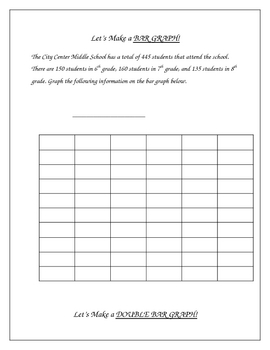
Constructing Graphs - Bar Graphs, Line Graphs, Circle Graphs
**I revised the numbers in the pie graph on this from the first version, these amounts are much more friendly** This activity includes construction of a bar graph, double bar graph, line graph, double line graph, and a circle graph.I put this together after being frustrated about not being able to find any graphing activities appropriate for intermediate grades that would allow me to make graphs with the class on my smartboard. I needed some examples to demonstrate how to take data and create a
Subjects:
Grades:
3rd - 10th, Adult Education
Types:
Histograms and Frequency Tables (Powerpoint) for Busy Teachers
This powerpoint presentation introduces the concept of histograms and frequency tables.
Clipart, sounds, and animation are used sparingly and effectively to help illustrate points without being distracting. This powerpoint presentation has been extensively refined using faculty AND student input and feedback.
Definitions of histogram, interval, frequency table, and frequency are all presented. The progression from a frequency table to a completed histogram is illustrated and animated using
Subjects:
Grades:
4th - 12th, Higher Education, Adult Education
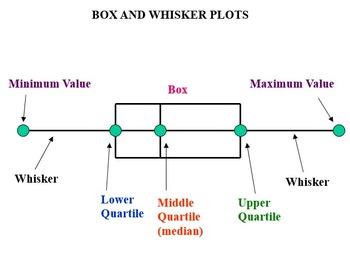
Graphing Galore! (PowerPoint presentation on data and graphing)
This is a PowerPoint presentation loaded with lots of graphing and data information. In this presentation students learn vocabulary, how to organize data, the difference between different types of graphs, how to set up different graphs, and there are examples for students to try on their own in order to check for understanding. This presentation includes the following information:
--Mean, Median, Mode, Range
--Outliers
--Line Plots
--Frequency Tables
--Relative Frequency
--Histograms
--Stem &a
Subjects:
Grades:
6th - 9th

Introduction to Functions
A power-point presentation about "Graphing Functions". Slides show other terms associated with functions, provide student friendly descriptions of terms, pictures, examples, video links, etc.
Grades:
6th - 9th
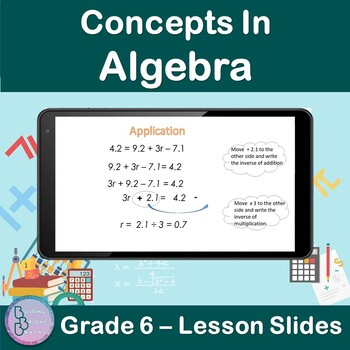
Concepts in Algebra | 6th Grade PowerPoint Lesson Slides | Algebraic Patterns
Are you teaching your students about Concepts In Algebra For 6th Grade? Plenty of examples and application exercises are included. You can also easily convert this to a Google Slides lesson by dragging it into your Google Drive.What is included?✦ 47 total slides for notes, examples and applications.✦ All steps are animated to allow the teacher to explain them gradually. At the end of the lesson, students will be able to✦ Solve Algebraic Patterns ✦ Solve Two-Step Equations✦ Solve Addition and Sub
Grades:
5th - 7th
Data Representation Powerpoint
The presentation contains: 1) TALLY MARKS Learning Objectives. Definition of a tally mark. Uses of tally mark. How to count a tally mark. Tally Mark Chart. Construction of a tally mark table with an example. Application on real life problems on tally mark. Read and Interpret a tally mark table.The presentation contains: 2) FREQUENCY DISTRIBUTION TABLEDefinition of a Frequency Distribution Table. Types of Frequency Distribution Table: a) Discrete Frequency Distribution Table (Ungrouped).b) C
Subjects:
Grades:
1st - 10th, Higher Education, Staff
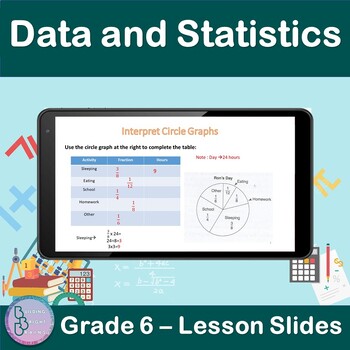
Data and Statistics | 6th Grade PowerPoint Lesson Slides | Circle Graphs
Are you teaching your students about Data and Statistics For 6th Grade? Plenty of examples and application exercises are included. You can also easily convert this to a Google Slides lesson by dragging it into your Google Drive.What is included?✦ 9 total slides for notes, examples and applications.✦ All steps are animated to allow the teacher to explain them gradually. At the end of the lesson, students will be able to✦ Interpret Circle Graphs.✦ Use a circle graph to complete s table.✦ Use a cir
Subjects:
Grades:
5th - 7th
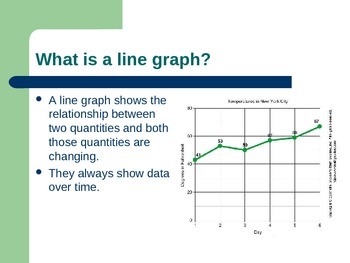
Graphing Powerpoint
This is an introductory PowerPoint graphing. The PowerPoint includes:
-Different types of graphs
-Vocabulary used to construct a graph
-How to construct a line graph
Notes of formatted is such a way that they can easily be used in A.V.I.D. Cornell Note style with the heading being used as the question in the left column and the notes for the right column.
Subjects:
Grades:
5th - 7th
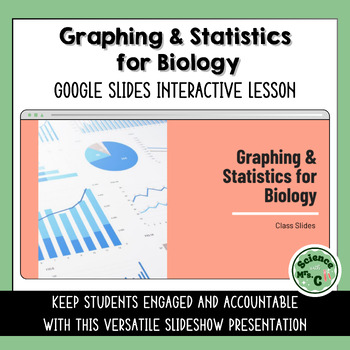
Graphing & Statistics for Biology Google Slides Lesson
Features a Google Slides lesson/presentation that reviews how to make scientific data tables, graph scientific data, and calculate mean, median, mode, and range.The topics covered in this presentation include:Identifying types of DataConstructing Data TablesCalculating Mean, Median, Mode, Range & Standard DeviationPlotting a GraphInterpolation & Extrapolation of DataKeep your students engaged and accountable with this interactive, versatile presentation. Embedded within these 27 colorful
Subjects:
Grades:
6th - 12th
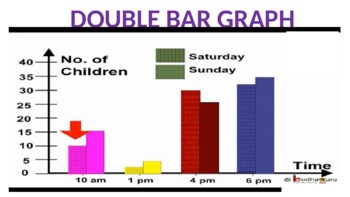
Double Bar Graph Powerpoint
The presentation contains:Learning Objectives.Definition of a double bar graph.Parts of a double bar graph.Difference between bar graph and double bar graph.Tips for construction of double bar graph.Steps to construct double bar graph with an example.To read and interpret the double bar graph.
Subjects:
Grades:
5th - 10th, Staff
Also included in: Data Representation Powerpoint
Pie Chart Powerpoint
The presentation contains:Learning Objectives.Definition of a Pie Chart.Tips for construction of pie chart.Steps to construct a pie chart with an example.Scaling and drawing a pie chart.Read and Interpret a pie chart.
Subjects:
Grades:
5th - 10th, Staff
Also included in: Data Representation Powerpoint
Equations, Tables, and Graphs
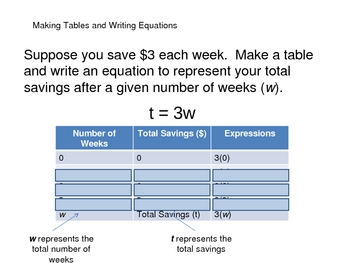
This powerpoint shows students how to graph a linear equation (pre Algebra - not understanding slope and y-intercept yet) with x & y tables. The powerpoint takes the outcome of the x/y tables, puts them into ordered pairs (x,y)and graphs the points and lines on a coordinate plane. I have used this lesson with both an interwrite pad and samrtboard.
Coordinate Plane & Graphing Powerpoint/Lesson - Functions, Relations, Domain
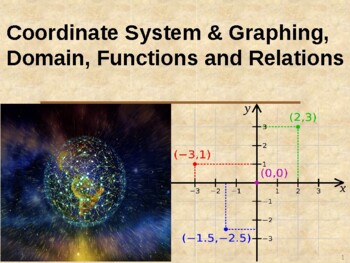
This 103-slide lesson covers the coordinate plane, coordinates, quadrants, and how to plot points. It starts with a brief review of integers on the number line. It later covers the concepts of functions and relations and how to tell the difference. Domain and range are also included. There are many practice problems with step-by-step animation to show how problems are solved, and several review quizzes throughout.About 3-3.5 hours of material, best taught over 3-4 lessons.
Guided Notes PowerPoint: Converting Equations From Standard to Slope-Int Form
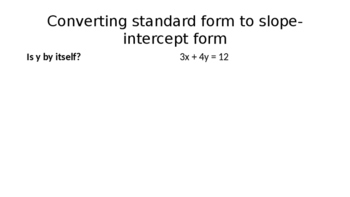
This PowerPoint contains guided notes on how to convert equations from standard form to slope-intercept form using an easy 2-step process. Each process is color coordinated to help students see how each step is being made. The second half of the PowerPoint contains guided notes on how to graph the equation once it is in slope-intercept form using an easy 3-step process. Again, the steps are color coordinated to help the students see each step worked out. It might even be a good idea to have stud
Subjects:
Grades:
6th - 10th
Introduction to Data Visualization
This presentation introduces key concepts and considerations in data visualization, including:the history of data visualizationan introduction to the benefits and importance of data visualization types of visualizationshow to choose a visualization typedata visualization design principles and best practicesleading data visualization platforms the differences between raster and vector graphicskey considerations when thinking about creating a visualization Use this as part of a unit on graphing, d
Subjects:
Grades:
6th - 12th, Higher Education, Adult Education, Staff
Also included in: Graphic Design Growing Bundle
Line Graph Powerpoint
The presentation contains:Learning objectives.Definition of a line graph.Parts of a line graph.Tips for construction of line graph.Steps to construct line graph with an example.Reading and Interpreting a line graph.Advantage of line graph.
Subjects:
Grades:
5th - 10th, Staff
Also included in: Data Representation Powerpoint
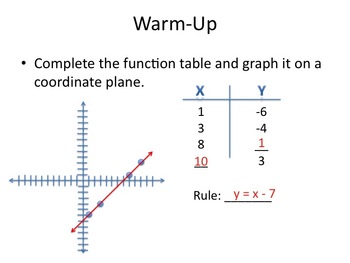
Graphing Linear Equations (focus on Real-Life Situations)
This PowerPoint can be used to introduce students to graphing linear equations. It should be played as a slideshow, where it steps students through linear equations by starting with the basic idea of graphing a function. The presentation ramps up to focusing on real-life situations that might be represented by a function. The show ends by looking at different graphs and asking students to think of a real-world situation that might match the given graph.
Grades:
5th - 8th
CCSS:
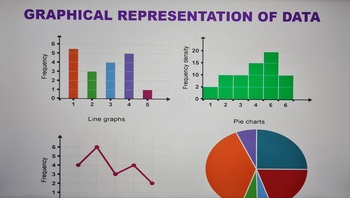
Graphical Representation of Data Powerpoint
The presentation contains the follows:1) BAR GRAPH Learning objectives. Definition of a bar graph. Parts of a bar graph. Tips for construction of bar graph. Steps to construct bar graph with an example. Types of bar graph. Advantages of bar graph. 2) DOUBLE BAR GRAPH Learning Objectives. Definition of a double bar graph. Parts of a double bar graph. Difference between bar graph and double bar graph. Tips for construction of double bar graph. Steps to construct double bar graph wit
Subjects:
Grades:
5th - 9th, Staff
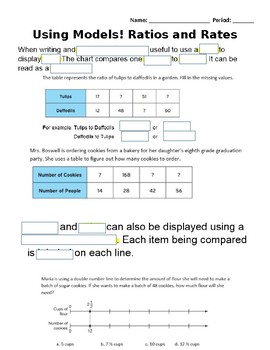
Using Models to Represent Ratios, Rates and Unit Rates Scaffold Notes
Students will use these fill in the blank notes to guide them through the Smartboard lesson on Models for ratios, rates and unit rates (located in store). Each page of the lesson is a screen shot with missing words. Students will fill in the blank and answer practice problems on handout. There is a lot an answer doc with the missing words filled in for any students with accommodations.
Subjects:
Grades:
5th - 7th
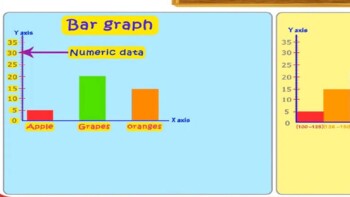
Bar Graph Powerpoint
The presentation contains:Learning objectives.Definition of a bar graph.Parts of a bar graph.Tips for construction of bar graph.Steps to construct bar graph with an example.Types of bar graph.Advantages of bar graph.
Subjects:
Grades:
6th - 9th, Higher Education, Staff
Also included in: Data Representation Powerpoint
Lesson on Linear Equations, Slope, and Slope Intercept Form - Graphing
This 42- slide lesson/Powerpoint lecture on graphing with the coordinate plane includes slope, intercept, linear equations and other pre-algebra topics. It is highly animated, showing step-by-step how to perform calculations.Main topics include:Definition of line and linear equation with examplesIdentifying sign of slopeCalculating slopeSpecial cases - no slope and undefined slopeSlope-intercept form - what it is and how to write equations in this formThis would be appropriate for 6th grade or a
Grades:
5th - 7th
Computer Science in One Hour! Grades 5-8 Math or ELA! No experience needed!
Computer science and coding are what all the kids are talking about! This is a scripted, colorful lesson plan with activities for students! Absolutely no computer science or technology experience necessary! Your students will be fully engaged. This lesson shows a step-by-step guide to basic computer science concepts, which will lead your students to writing actual code within the first 10 minutes! This lesson may be adapted in either an English/language arts class or a math class grades 5-8
Subjects:
Grades:
5th - 8th
Types:
Science inferences lesson (charts and graphs)
This lesson takes kids through inferencing first with the book ZOOM and then with an advertisement (what are they trying to say about their product) and then looks at charts and graphs kids need to use in science to make inferences from.

Transformations Note and examples - PPT
This is a very detailed powerpoint notes slide for transformations. It includes:
-Definition of transformations
-Translations and examples
- Reflections and ex
- Rotations and Symmetry with a lot of picture examples
- A slide teaching students how to find rotational symmetry and the degrees
- A funny example using a persons face for line symmetry that kids love
- A table at the end where students are given pictures and they need to label LS, Rotational Symmetry degrees, points of symmetry, etc.
Showing 1-24 of 54 results


