5 results
High school statistics homeschool curriculum pdfs $5-10
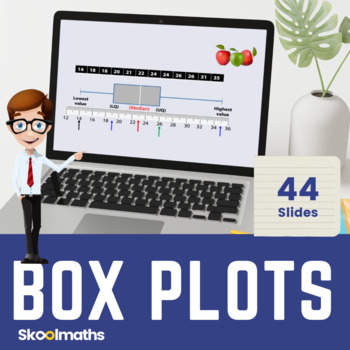
Box and Whisker Plots Digital Lesson and Activities for Middle School
Box and Whisker Plots Digital Lesson and Activities for Middle SchoolBox Plots is a completely interactive lesson designed for Middle school to High School Statistics and Probability.Contents:This bundle pack contains:44 interactive slides with dynamic graphics that will engage your studentsInteractive Drag and Drop activities on find averages as well as instant learner feedbackPrintable Worksheets with answers includedDifferentiated questions and answersCan be used as Home Learning Resource and
Subjects:
Grades:
6th - 9th
Also included in: Complete Statistics and Probability Bundle | Digital and Print
A Fun Introduction to Probability
This product contains fourteen pages that introduce probability by graphing the LEGOs and comparing the number of studs on LEGO bricks. These statistics will be figured in fractions, decimals and percentages. Graphing will be done on bar graphs and pie graphs. The worksheets are colorful and engaging for students. Students will learn to find the mean, median and mode of different numbers of studs on LEGO bricks. Students will find their own statistics and combine them with the statistics of ot
Subjects:
Grades:
4th - 9th
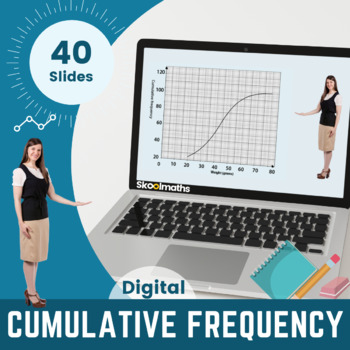
Cumulative Frequency - Digital Lesson and Activities for 9th-10th Grade
In this lesson, learners will be able to:1) construct and interpret cumulative frequency graphs, 2) interpret, analyze and compare the distributions of data sets through quartiles and inter-quartile range The lesson can be used as whole class teaching by teachers and at home by learners.Lots of drag and drop activities with instant feedback. Contains 40 interactive pagesTo open this lesson you need to unzip or extract the files.Choose index.html to view onlineThis lesson can also be viewed offl
Subjects:
Grades:
9th - 10th, Higher Education, Staff
Also included in: Complete Statistics and Probability Bundle | Digital and Print
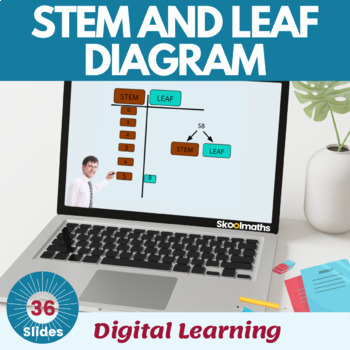
Stem and Leaf Diagrams - Digital Math Lesson and Activities for 9th - 10th Grade
A Stem and Leaf Plot is a special table where each data value is split into a "stem" (the first digit or digits) and a "leaf" (usually the last digit). In this lesson, learners will be able to use stem and leaf diagrams to calculate mean, median, mode, interquartile range, lower quartile, upper quartile, and analyze the given data using these measurements.This fun-packed math lesson can be used as whole class teaching by teachers and at home by learners; with lots of drag and drop activities as
Subjects:
Grades:
8th - 10th, Higher Education
Types:
CCSS:
Also included in: Complete Statistics and Probability Bundle | Digital and Print
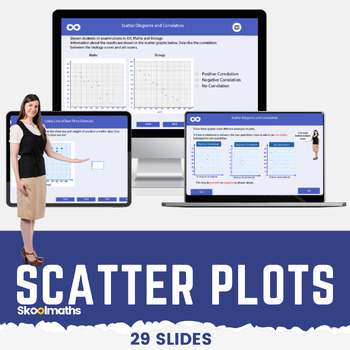
Scatter Plots | Correlation | Line of Best Fit Digital Math Lesson CCSS 8.SP.A.1
Scatter Plots | Correlation | Line of Best Fit Digital Math Lesson CCSS8.SP.A.1Want a high-engagement interactive math lesson that will teach your high school grade how to use and interpret scatter graphs; recognize correlation; draw and use lines of best fit to make predictions?In this lesson, learners will be able to:use and interpret scatter graphs of bivariate data;recognize different types of correlation;draw estimated lines of best fit; anduse lines of best fit to make predictions.The less
Subjects:
Grades:
8th - 10th
CCSS:
Also included in: Complete Statistics and Probability Bundle | Digital and Print
Showing 1-5 of 5 results


