100 results
Statistics assessments for staff
Essentials of Statistics for Business and Economics, 10th Ed Jeffrey SOLUTIONS
SOLUTIONS MANUAL Essentials of Statistics for Business and Economics, 10th Edition Jeffrey D. Camm, James J. Cochran, Michael J. Fry, Jeffrey W. Ohlmann, David R. Anderson, Dennis J. Sweeney, Thomas A. WilliamsTABLE OF CONTENTS1. Data and Statistics.2. Descriptive Statistics: Tabular and Graphical Displays.3. Descriptive Statistics: Numerical Measures.4. Introduction to Probability.5. Discrete Probability Distributions.6. Continuous Probability Distributions.7. Sampling and Sampling Distribution
Subjects:
Grades:
Higher Education, Adult Education, Staff
Statistics for Business and Economics 14th Edition James George SOLUTIONS MANUAL
SOLUTIONS MANUAL for Statistics for Business and Economics 14th Edition James T. McClave; P. George Benson; Terry T SincichTABLE OF CONTENTSCHAPTER 1. Statistics, Data, and Statistical Thinking CHAPTER 2. Methods for Describing Sets of DataCHAPTER 3. ProbabilityCHAPTER 4. Random Variables and Probability DistributionsCHAPTER 5. Sampling Distributions CHAPTER 6. Inferences Based on a Single Sample: Estimation with Confidence IntervalsCHAPTER 7. Inferences Based on a Single Sample: Tests of Hypoth
Subjects:
Grades:
Higher Education, Adult Education, Staff
Statistics for Business and Economics 14th Edition By James, George TEST BANK
TEST BANK for Statistics for Business and Economics 14th Edition James T. McClave; P. George Benson; Terry T SincichTABLE OF CONTENTSCHAPTER 1. Statistics, Data, and Statistical Thinking CHAPTER 2. Methods for Describing Sets of DataCHAPTER 3. ProbabilityCHAPTER 4. Random Variables and Probability DistributionsCHAPTER 5. Sampling Distributions CHAPTER 6. Inferences Based on a Single Sample: Estimation with Confidence IntervalsCHAPTER 7. Inferences Based on a Single Sample: Tests of HypothesesCHA
Subjects:
Grades:
Higher Education, Adult Education, Staff
Basic Statistics for Business And Economics 7th Edition By Douglas TEST BANK
Test Bank For Basic Statistics for Business And Economics 7th Edition By Douglas A. Lind, William G. Marchal, Samuel A. Wathen, Carol Ann Waite, Kevin MurphyTABLE OF CONTENTSCHAPTER 1: What Is Statistics? CHAPTER 2: Describing Data: Frequency Tables, Frequency Distributions and Graphic Presentation CHAPTER 3: Describing Data: Numerical Measures CHAPTER 4: A Survey of Probability Concepts CHAPTER 5: Discrete Probability Distributions CHAPTER 6: Continuous Probability Distributions CHAPTER 7: Samp
Subjects:
Grades:
Higher Education, Adult Education, Staff
Basic Business Statistics: Concepts and Applications 11th Ed Berenson TEST BANK
TEST BANK for Basic Business Statistics: Concepts and Applications 11th Edition by Mark Berenson, David Levine and Timothy Krehbiel. TABLE OF CONTENTSChapter 1: Introduction and Data Collection Chapter 2: Presenting Data in Tables and Charts Chapter 3: Numerical Descriptive Measures Chapter 4: Basic Probability Chapter 5: Some Important Discrete Probability Distributions Chapter 6: The Normal Distribution and Other Continuous Distributions Chapter 7: Sampling and Sampling Distributions Chapter 8
Subjects:
Grades:
Higher Education, Adult Education, Staff
Applied Statistics in Business and Economics 7th Edition David Doane TEST BANK
TEST BANK for Applied Statistics in Business and Economics 7th Edition by David Doane & Lori Seward.TABLE OF CONTENTS:Chapter 1: Overview of Statistics Chapter 2: Data Collection Chapter 3: Describing Data Visually Chapter 4: Descriptive Statistics Chapter 5: Probability Chapter 6: Discrete Probability Distributions Chapter 7: Continuous Probability Distributions Chapter 8: Sampling Distributions and Estimation Chapter 9: One-Sample Hypothesis Tests Chapter 10: Two-Sample Hypothesis Tests Ch
Subjects:
Grades:
Higher Education, Adult Education, Staff
Elementary Statistics: A Step by Step Approach 10th Edition Bluman TEST BANK
TEST BANK for Elementary Statistics: A Step by Step Approach 10th Edition Bluman Allan. TABLE OF CONTENTS:CHAPTER 1: The Nature of Probability and Statistics CHAPTER 2 Frequen cy Distributions and Graphs CHAPTER 3 Data Description CHAPTER 4 Probability and Counting Rules CHAPTER 5 Discrete Probability Distributions CHAPTER 6 The Normal Distribution CHAPTER 7 Confidence Intervals and Sample Size CHAPTER 8 Hypothesis Testing CHAPTER 9: Testing the Difference Between Two Means, Two Proportions, and
Subjects:
Grades:
Higher Education, Adult Education, Staff
Practice of Statistics in the Life Sciences 4th Edition by Brigitte TEST BANK
TEST BANK for Practice of Statistics in the Life Sciences, 4th Edition Brigitte Baldi; David S. MooreTABLE OF CONTENT:CHAPTER 1 Picturing Distributions with GraphsCHAPTER 2 Describing Quantitative Distributions with NumbersCHAPTER 3 Scatterplots and CorrelationCHAPTER 4 RegressionCHAPTER 5 Two-Way TablesCHAPTER 6 Samples and Observational StudiesCHAPTER 7 Designing ExperimentsCHAPTER 8 Collecting and Exploring Data: Part I ReviewCHAPTER 9 Essential Probability RulesCHAPTER 10 Independence and Co
Subjects:
Grades:
Higher Education, Adult Education, Staff
Statistics for Management and Economics + XLSTAT Bind-in 11th Ed Gerald_SM
SOLUTIONS MANUAL for Statistics for Management and Economics (with XLSTAT Bind-in) 11th Edition by Gerald KellerTable of Content:Chapter 1: What Is Statistics?Chapter 2: Graphical Descriptive Techniques IChapter 3: Graphical Descriptive Techniques IIChapter 4: Numerical Descriptive TechniquesAppendix 4: Review of Descriptive TechniquesChapter 5: Data Collection And SamplingChapter 6: ProbabilityChapter 7: Random Variables and Discrete Probability DistributionsChapter 8: Continuous Probability Di
Subjects:
Grades:
Higher Education, Adult Education, Staff
Introductory Statistics_Exploring the World Through Data 3rd Ed Gould TEST BANK
TEST BANK for Introductory Statistics: Exploring the World Through Data 3rd Edition by Robert Gould, Rebecca Wong and Colleen RyanTABLE OF CONTENTS:Chapter 1 Introduction to Data Chapter 2 Picturing Variation with Graphs Chapter 3 Numerical Summaries of Center and Variation Answer Chapter 4 Regression Analysis: Exploring Associations between Variables Chapter 5 Modeling Variation with ProbabilityChapter 6 Modeling Random Events: The Normal and Binomial ModelsChapter 7 Survey Sampling and Inferen
Subjects:
Grades:
Higher Education, Adult Education, Staff
Elementary Statistics Picturing the World 8th Edition By Ron SOLUTIONS MANUAL
SOLUTIONS MANUAL for Elementary Statistics Picturing the World 8th Edition by Ron Larson, Betsy Faber TABLE OF CONTENTSChapter 1 Introduction to Statistics 1Chapter 2 Descriptive Statistics 14Chapter 3 Probability 105Chapter 4 Discrete Probability Distributions 140Chapter 5 Normal Probability Distributions 173Chapter 6 Confidence Intervals 226Chapter 7 Hypothesis Testing with One Sample 255Chapter 8 Hypothesis Testing with Two Samples 308Chapter 9 Correlation and Regression 355Chapter 10 Chi-Squ
Subjects:
Grades:
Higher Education, Adult Education, Staff
Sampling Design and Analysis, 3rd Edition by Sharon Lohr. SOLUTIONS MANUAL
SOLUTIONS MANUAL for Sampling Design and Analysis, 3rd Edition by Sharon Lohr.TABLE OF CONTENTS:1. Introduction 2. Simple Probability Samples 3. Stratified Sampling 4. Ratio and Regression Estimation 5. Cluster Sampling with Equal Probabilities 6. Sampling with Unequal Probabilities 7. Complex Surveys 8. Nonresponse 9. Variance Estimation in Complex Surveys 10. Categorical Data Analysis in Complex Surveys 11. Regression in Complex Surveys 12. Two-Phase Sampling 13. Estimating the Size of a P
Grades:
Higher Education, Adult Education, Staff
The Analysis of Biological Data Third Edition by Michael and Dolph TEST BANK
The Analysis of Biological Data Third Edition by Michael Whitlock, Dolph SchluterTABLE OF CONTENTS:Chapter 1 Statistics and samplesChapter 2 Displaying dataChapter 3 Describing dataChapter 4 Estimating with uncertaintyChapter 5 ProbabilityChapter 6 Hypothesis testingChapter 7 Analyzing proportionsChapter 8 Fitting probability models to frequency dataChapter 9 Contingency analysis: Associations between categorical variationsChapter 10 The normal distributionChapter 11 Inference for a normal popul
Subjects:
Grades:
Higher Education, Adult Education, Staff
Business Intelligence, Analytics and Data Science Ramesh Dursun TEST BANK
TEST BANK for Business Intelligence, Analytics, and Data Science A Managerial Perspective, 4th edition Ramesh, Dursun and Efraim An Overview of Business Intelligence, Analytics, and Data Science Descriptive Analytics I: Nature of Data, Statistical Modeling, and Visualization Descriptive Analytics II: Business Intelligence and Data Warehousing Predictive Analytics I: Data Mining Process, Methods, and Algorithms Predictive Analytics II: Text, Web, and Social Media Analytics Prescriptive Analytics:
Subjects:
Grades:
Higher Education, Adult Education, Staff
Statistics The Art and Science of Learning from Data 3rd Ed Alan TEST BANK
TEST BANK for Statistics: The Art and Science of Learning from Data (3rd Edition) 3rd Edition by Alan Agresti and Christine Franklin TABLE OF CONTENTS:Chapter 1 Statistics: The Art and Science of Learning fromChapter 2 Exploring Data with Graphs and Numerical Summaries 23Chapter 3 Association: Contingency, Correlation, and Regression Chapter 4 Gathering Data 149Chapter 5 Probability in Our DailyChapter 6 Probability DistributionsChapter 7 Sampling DistributionsChapter 8 Statistical Inference: Co
Subjects:
Grades:
Higher Education, Adult Education, Staff
Probability and Statistical Inference 10th Edition by Hogg, Elliot TEST BANK
SOLUTIONS MANUAL for Probability and Statistical Inference 10th Edition by Robert Hogg, Elliot Tanis, Dale Zimmerman TABLE OF CONTENTS:Chapter 1: ProbabilityChapter 2: Discrete DistributionsChapter 3: Continuous DistributionsChapter 4: Bivariate DistributionsChapter 5: Distributions of Functions of Random VariablesChapter 6: Point EstimationChapter 7: Interval EstimationChapter 8: Tests of Statistical HypothesesChapter 9: More Tests
Subjects:
Grades:
Higher Education, Adult Education, Staff
TEST BANK for Basic Statistics for Business and Economics 10th Edition by Dougla
TEST BANK for Basic Statistics for Business and Economics 10th Edition by Douglas A. Lind. ISBN 9781264086870. All 15 Chapters.TABLE OF CONTENTS:Chapter 1: What is Statistics? Chapter 2: Describing Data: Frequency Tables, FrequencyDistributions, and Graphic Presentation Chapter 3: Describing Data: Numerical Measures Chapter 4: Describing Data: Displaying and Exploring Data Chapter 5: A Survey of Probability Concepts Chapter 6: Discrete Probability Distributions Chapter 7: Continuous Probability
Subjects:
Grades:
Higher Education, Adult Education, Staff
Data Analysis Statistics and Probability worksheets (63 Problems) (SAT Review)
Data analysis statistics and probability worksheets ,63 problemsSAT ReviewFraction and Data (29 Multiple choice questions)Statistic Problem (15 questions)Probability Word Problems This section contains 19 word problems about :Simple ProbabilityCounting PrincipleIndependent ProbabilityDependent ProbabilityMutually Exclusive EventsPermutationsCombinationsConditional Probability* AlSO AVAILABLE FOR YOU OR A COLLEAGUE! - CLICK ANY LINK YOU WANT:Number and Operations (SAT Review) Algebra & Functi
Subjects:
Grades:
7th - 12th, Higher Education, Adult Education, Staff
Types:
Sampling-Design-and-Analysis-2nd-Edition-Sharon-Lohr-SOLUTIONS-MANUAL
SOLUTIONS-MANUAL for Sampling-Design-and-Analysis-2nd-Edition-Sharon-Lohr-Complete Chapters 1-15
Subjects:
Grades:
Higher Education, Adult Education, Staff
Conditional Probability and Two-Way Worksheet, CW, HW, Review CP Stats, Ap Stats
If you are looking for an easy to follow for students. You are at the right place. This is a quick and easy to follow activity sheet that brings across the concept clear and precise. Teachers in my department love this activity sheet. This is useful of CP Probability and Statistics, AP Statistics and Algebra 1 statistics unit.Probability and Conditional Probability ObjectivesAt the end of the lesson students should be able to:1. Interpret two-way tables2. Create relative frequency tables for wh
Subjects:
Grades:
9th - 12th, Higher Education, Adult Education, Staff
CCSS:
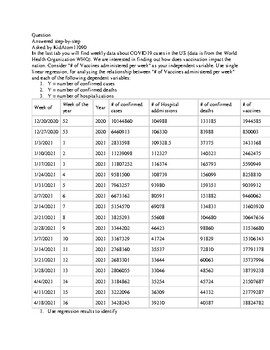
How does vaccination impact the nation-COVID19_Cases_in_the US_ MATH-Statistics
In the last tab you will find weekly data about COVID19 cases in the US (data is from the World Health Organization WHO). We are interested in finding out how does vaccination impact the nation. Consider "# of Vaccines administered per week" as your independent variable. Use single linear regression, for analyzing the relationship between "# of Vaccines administered per week" and each of the following dependent variables: Y = number of confirmed casesY = number of confirmed deathsY = number of h
Subjects:
Grades:
Higher Education, Adult Education, Staff
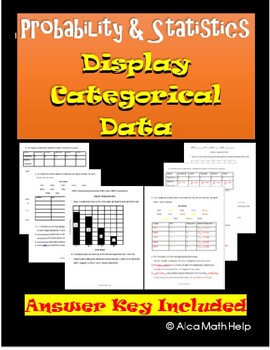
Categorical Data Display Pie Chart & Bar Chart: Worksheet, CW, HW CP & AP Stats
If you are looking for an easy to follow for students. You are at the right place. This is a quick and easy to follow activity sheet that brings across the concept clear and precise. Teachers in my department love this activity sheet. This is useful of CP Probability and Statistics, AP Statistics and Algebra 1 statistics unit. Categorical data and Display Variables ObjectivesAt the end of the lesson students should be able to:1. Correctly define categorical and quantitative data with examples2.
Subjects:
Grades:
8th - 12th, Higher Education, Adult Education, Staff
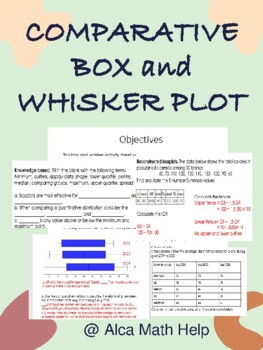
Comparison Box and Whisker Plots Worksheet, Quiz, Test for Stats & AP Stats
This box and whisker activity sheet was designed to test students understanding of the 5 number summary data values given quantitative data sets. Perfect for students in grade 10-12 doing statistics and you want to give them a challenge and should be manageable for students doing AP STATSAt the end of this activity students should be able to1. Students should be able to explain and construct box plots showing the different regions and what they represent. 2. Students should also be able to use
Subjects:
Grades:
11th - 12th, Higher Education, Adult Education, Staff
CCSS:
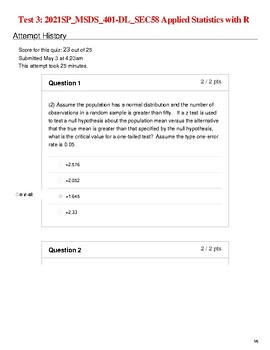
Test 3| 2021 SP_MSDS_401-DL_SEC58 Applied Statistics with R
Test 3| 2021 SP_MSDS_401-DL_SEC58 Applied Statistics with R(2) Assume the population has a normal distribution and the number of observations in a random sample is greater than fifty. If a z test is used to test a null hypothesis about the population mean versus the alternative that the true mean is greater than that specified by the null hypothesis, what is the critical value for a one-tailed test? Assume the type one-error rate is 0.05. FalseTrue(1) Answer True or FalseAssume a random sample
Subjects:
Grades:
Higher Education, Adult Education, Staff
Showing 1-24 of 100 results


