TPT
Total:
$0.00
Selected
Subjects
38 results

Science Common Core 8.F.B.4 resources
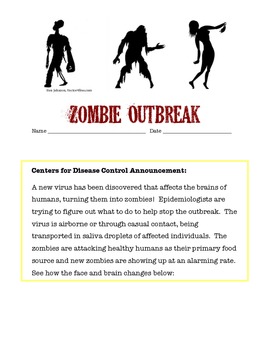
Preview of Investigating the Spread of a Viral Outbreak
Investigating the Spread of a Viral Outbreak

Created by
Ruddy4Learning
Students in grades 5 - 9 model the spread of an infectious disease under the entertaining theme of a zombie outbreak. One student unknowingly is patient zero and students simulate the spread of an airborne illness. This highly engaging activity covers health topics, nature of science, and math skills as students graph data in a line plot. Higher level students can be challenged to find the function of the exponential growth of the outbreak.
Preview of Scientific Thinking Unit Bundle

Scientific Thinking Unit Bundle

3 fully editable, NGSS/modeling pedagogy aligned worksheets, 4 inquiry labs, 3 lab challenges, 2 quizzes, 6 guided notes/reading assignments, 1 unit review, 1 writing assignment, 1 equation toolbox, and 1 curriculum guide!WorksheetsThere are a variety of free response questions for most worksheets, which are usually one or two pages long. Worksheets are used for students to deploy models developed from inquiry labs and as a way to practice problem-solving en route to mastery of learning targets
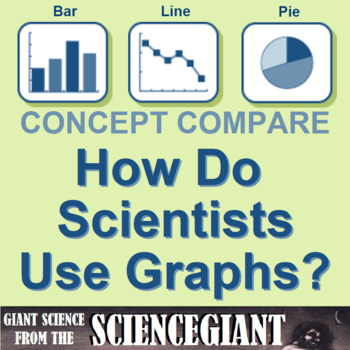
Preview of Concept Comparison: Graphs in Science (Categorical vs Numerical)
Concept Comparison: Graphs in Science (Categorical vs Numerical)

Created by
TheScienceGiant
How do scientists use graphs? This concept comparison helps students contrast bar graphs, pie charts and line graphs created from categorical and numerical data. The recall device uses DRY MIX and TRAILS as acronyms to help Ss remember how variables are plotted on a graph, and standard format for a graph. The frame comparison helps students contrast rate of change, slope shape and written relationships of functions (y vs. x; y vs. x^2; y vs. 1/x, and so on). THREE (3) activities are included:ha
Preview of Spring Action Lab: A Bouncy and Engaging STEM Lab
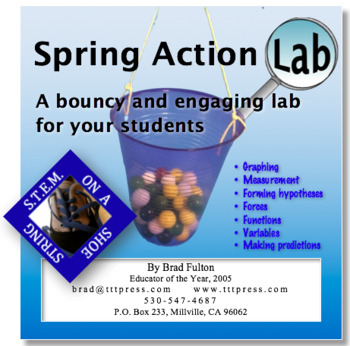
Spring Action Lab: A Bouncy and Engaging STEM Lab

Students will enjoy putting their learning to work in this engaging lab. Using springs or rubber bands, students measure and record data as they try to get a bucket to touch the floor by adding weights. Then they use their data and its graph to make predictions and write equations that will help them predict the outcomes. This simple and inexpensive lab will help your students learn graphing, t-tables, measurement, linear functions, and the physics of tension forces. This can be used as a stand-
Preview of Types of Slope & Y Intercept: Interactive Distance Learning Google Classroom
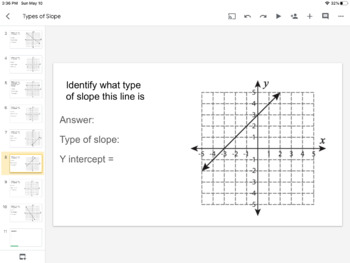
Types of Slope & Y Intercept: Interactive Distance Learning Google Classroom

Created by
Raffi Sarajian
This is a great interactive online lesson which is compatible for google classroom and distance learning to help students get familiar with the different types of slope, (positive, negative, zero, undefined). Also the students will practice finding and Identifying the Y-intercept as well. Students will use the interactive activity to practice the skills required to move onto linear equations. Great tool to use to make a screen-cast video for your students!
Preview of *NEW* Winter Break Pack!!! Students research air quality in their neighborhood
*NEW* Winter Break Pack!!! Students research air quality in their neighborhood

Created by
katy curric
Middle School Math & Science Teachers!!!***Save time and energy with this all-inclusive winter break packet***SUMMARYStudents use free online resources to learn about air quality in their neighborhood. Activity 1Students learn what air quality is and how it is measured Activity 2Students use the free online PurpleAir map to find an air quality monitor near their home/school, then process their learning by drafting an Air Quality News Report. - Scaffolded sentence stems included - Expand by h
Preview of Tracking Hurricane Sandy!

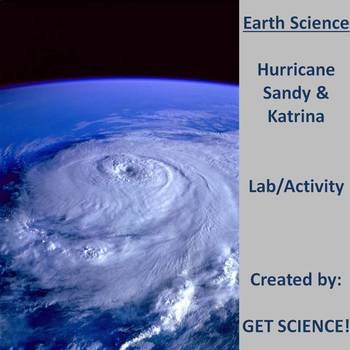
Tracking Hurricane Sandy!

Created by
Get Science
This 6 page lab activity will help students remember where hurricanes form and why. The lab explores the differences and similarities between Hurricane Sandy and Hurricane Katrina. Students will practice their skill of plotting using latitude and longitude as they plot the tracks of both. The Saffir-Simpson scale will be used as students analyze data from both storms. Students will plot pressure vs. wind speed to understand the relationship and answer questions based on the data and general h
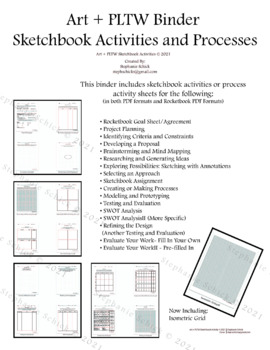
Preview of PLTW, Science and Art Processes and Activities Binder
PLTW, Science and Art Processes and Activities Binder

Created by
Winter Studios
Art + PLTW + Science BinderSketchbook Activities and ProcessesThis binder includes (in both PDF formats and Rocketbook PDF Formats) sketchbook activities or process activity sheets for the following:• Rocketbook Goal Sheet/Agreement• Project Planning• Identifying Criteria and Constraints• Developing a Proposal• Brainstorming and Mind Mapping• Researching and Generating Ideas• Exploring Possibilities: Sketching with Annotations• Selecting an Approach• Sketchbook Assignment• Creating or Making Pro
Preview of An INTRODUCTION to GASES

An INTRODUCTION to GASES

Created by
CHEM by Gloria
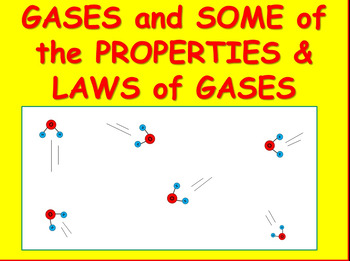
This PowerPoint introduces students to GASES, reviews the 4 states of matter, connects intra-molecular and intermolecular forces to the states of matter, and covers some of the properties and laws of gases.The Kinetic Molecular Theory is reviewed and Avogadro's Principle. The PowerPoint includes over 50 slides with many graphics and illustrations in order to explain the behavior and some of the laws of gases.
Preview of Human Population Graphing Lab

Human Population Graphing Lab

Created by
Get Science
This simple yet effective lab allows students to strengthen their graphing skills using real word data. Students will deal with larger numbers as they see the exponential growth of the global population.Students will practice rate of change problems and scientific notation. Students will also make observations and inferences on their findings.You may edit this lab. Answer key and Graph Paper provided. Website for current world population in real time provided.Educating the World Together!
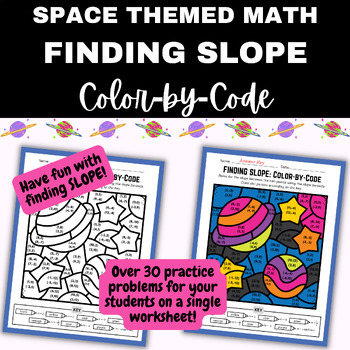
Preview of OUTER SPACE MATH Color by Code: Finding Slope Between Two Points
OUTER SPACE MATH Color by Code: Finding Slope Between Two Points

Looking for homework, classwork, workstations, or sub plans? This interactive math activity will reinforce your students' understanding of using the slope formula to find slope between two points(when given ordered pairs). This coloring worksheet will foster a sense of enjoyment, making math more approachable and less intimidating.This slope worksheet has an OUTER SPACE theme! There are over 30 problems on a color-by-number picture. The answer key is provided. Practicing finding the slope betwee
Preview of The Sounds of Summer: Bugs Do Functions Too!
The Sounds of Summer: Bugs Do Functions Too!

A cricket's chirp rate is graphed as a linear function resulting in a formula and t-table. Adaptations allow for both younger learners and more advanced students. Celsius and Fahrenheit units are included. The handout includes activity masters, step-by-step procedures, answer keys, Common Core alignment, and research tips. Links to audio files of cricket recordings are included in the instructions too.
Preview of Scientific Thinking Worksheets

Scientific Thinking Worksheets

3 fully editable, NGSS/modeling pedagogy aligned worksheets! There are a variety of free response questions for most worksheets, which are usually one or two pages long. Worksheets are used for students to deploy models developed from inquiry labs and as a way to practice problem-solving en route to mastery of learning targets before quizzes and unit tests. WS 1 - Math InventoryGiven a quantity, convert it to an equivalent value in a different unit. Given an equation and known values, substitute
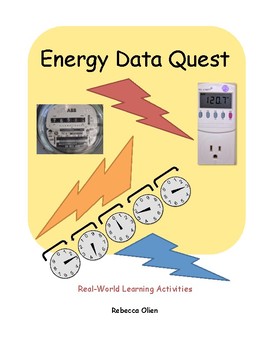
Preview of STEM: Energy Data Quest

STEM: Energy Data Quest

Created by
Rebecca Olien
The world’s demand for energy is growing at an alarming rate. Energy Data Quest lessons provides a way for students to explore energy use by collecting, examining, and using data. The lessons are designed to support collecting real-time data, working in design teams, and use critical thinking as they apply the data to offer solutions to better monitor and minimize energy consumption. Lessons include teacher pages that provide materials, directions, charts, parent letters, as well as extension a
Preview of 01 - Scientific Thinking Writing Assignment
01 - Scientific Thinking Writing Assignment

Fully editable, NGSS/modeling pedagogy aligned short writing assignment! These short writing assignments are usually one page long and include 3-4 short answer prompts that require students to explain and demonstrate their mastery of different learning targets covered in each unit. There is a rubric embedded at the bottom of each assignment as well for streamlined grading.Learning Targets Assessed:I know...the definition of a dependent variable and an independent variable.the definition of a lin
Preview of Motion Graphs Activity

Motion Graphs Activity

Created by
Stephan Gonzales
Students will use toy cars, timer, and ruler to create Distance vs. Time motion graphs. There is also an extension activity that challenges the students to model and graph an event that will show Distance vs. Time graphs can be used to keep people safe.
Preview of 01 - Density Lab Summary

01 - Density Lab Summary

Fully editable, NGSS/modeling pedagogy aligned inquiry lab summaries! Most lab summaries consist of 2 pages total, with space for students to provide the following information:Lab investigation purposeData for the independent and dependent variableWritten statement on data trendsSketch of a graphical model using a line of best fitLinear equation to mathematically model the relationship between the variablesAnalysis of physical meanings of slope and y-intercepts Space to list tools used and a bri
Preview of 01 - Marbles Lab Summary

01 - Marbles Lab Summary

Fully editable, NGSS/modeling pedagogy aligned inquiry lab summaries! Most lab summaries consist of 2 pages total, with space for students to provide the following information:Lab investigation purposeData for the independent and dependent variableWritten statement on data trendsSketch of a graphical model using a line of best fitLinear equation to mathematically model the relationship between the variablesAnalysis of physical meanings of slope and y-intercepts Space to list tools used and a bri
Preview of Graphing Activity - That Mu You Do - With Key
Graphing Activity - That Mu You Do - With Key

Created by
Fudge Factors
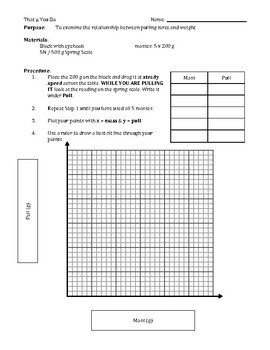
I do this activity with my freshman pre-algebra class to have them get experience with graphing "real data" points, then finding the slope of the "best fit line" and making meaning of what they did. A regular question in math class is "when am I ever going to use this?" This activity gives them something tactile to do with their hands that then makes the data points and the graph itself have real meaning for them and not just be numbers / dots on the page. I follow this activity up with "Graphin
Preview of Lesson 8. Parallel Lines, Transversals. Pythagorus, and Making Rafters
Lesson 8. Parallel Lines, Transversals. Pythagorus, and Making Rafters

Students will use parallel lines and transversal angles names and their relationships to better understand how to make a roof rafter. Students familiarize themselves with the required vocabulary to create a roof rafter.   Students have an opportunity to practice angle pair names and solving for unknown angles-Students determine how long their rafter will be?  (Solving for unknown side lengths in a right triangle using the Pythagorean Theorem)
Preview of 01 - Linear Relationships Guided Notes
01 - Linear Relationships Guided Notes

Fully editable, NGSS/modeling pedagogy aligned guided notes! Most guided notes provide in-context examples of concepts that will be heavily referenced and utilized throughout the unit, specifically with deploying the models to demonstrate the phenomenon being investigated. Guided notes include scaffolded diagrams and require students to respond to short-answer prompts.Learning Targets Assessed:I know...the definition of a dependent variable and an independent variable.the definition of a linear
Preview of 01 - Scientific Thinking WS 2 (Linear Relationships)
01 - Scientific Thinking WS 2 (Linear Relationships)

Fully editable, NGSS/modeling pedagogy aligned worksheet! There are a variety of free response questions for most worksheets, which are usually one or two pages long. Worksheets are used for students to deploy models developed from inquiry labs and as a way to practice problem-solving en route to mastery of learning targets before quizzes and unit tests. WS 1 - Math InventoryGiven a quantity, convert it to an equivalent value in a different unit. Given an equation and known values, substitute an
Preview of 01 - Linear Relationships Reading

01 - Linear Relationships Reading

Fully editable, NGSS/modeling pedagogy aligned reading assignment! Fully editable, NGSS/modeling pedagogy aligned reading assignment! Most reading assignments give an introduction and overview of concepts that will be heavily referenced and utilized throughout the unit, along with an space for students to summarize their learning by completing a fill-in-the-blank summary with a given word bank, or responding to short answer prompts.Learning Targets:I know...the definition of a dependent variable
Preview of 01 - Scientific Thinking Quiz 1

01 - Scientific Thinking Quiz 1

Fully editable, NGSS/modeling pedagogy aligned quiz! There is a mix of free-response and multiple-choice questions for most quizzes, which are usually one or two pages long. Quizzes are used for students to demonstrate proficiency of learning targets outlined in the corresponding curriculum guide by deployIng models developed from inquiry labs and utilized in problem-solving on worksheets. Quizzes are a good way for students to gauge their level of mastery to indicate how to study for unit tests
Showing 1-24 of 38 results

Find Science resources | TPT

Importance of learning science

Learning science is particularly important for students as it equips them with the essential knowledge and skills to make sense of the world around them. Science education is not just about memorizing facts. It fosters critical thinking, inquiry, and problem-solving abilities. These skills are not only useful in school but also in everyday life beyond the classroom.

Benefits of learning science

Learning science offers many benefits to students both in school and beyond. In fact, it helps students:

  • Question the world around them and seek evidence-based explanations
  • Cultivate their ability to observe, experiment, and analyze data
  • Nurture a sense of curiosity, awe, and wonder about the natural world
  • Understand natural phenomena and the laws that govern the universe

With a solid foundation in science, teachers can help empower students to think critically, solve problems, make informed decisions, and engage with the world around them in meaningful ways.

Teaching with science resources

One of the best parts about science class is all of the possibilities for hands-on, collaborative learning! Think: labs, experiments, inquiry-based activities, and design challenges. These activities encourage students to explore scientific concepts by observing, asking questions, and conducting investigations. Additionally, with small group centers, students can engage in group experiments, discussions, and projects that require them to collaborate, share ideas, and solve problems together.

Discover printable and digital science resources

If you’re a teacher or parent looking for printable or digital science resources, TPT has an extensive array of instructional materials for every learning need, topic, or grade level. Whether you're learning about plant parts or butterfly life cycles, or exploring advanced topics like the anatomy of a cell or Newton’s laws of motion, we've got you covered.

On TPT, science resources come in various forms: from labs and worksheets to craftivities and doodle notes. They can be used to enhance learning, assess a student’s mastery of science concepts, or to reteach a tricky topic. With plenty of TPT resources at your fingertips, teaching and learning science will be so much easier. Plus, you can expand students’ knowledge even further by exploring TPT math resources, which are frequently paired with science lessons.

Frequently asked questions about teaching science

What types of science lessons are available on TPT?

There are many different types of science resources sold by Sellers on TPT. Some popular science lessons include biology, earth sciences, chemistry, environment, engineering, and anatomy.

How do I find science lessons on TPT?

Educators can save time preparing science lessons with resources created by experienced teachers. Simply start a search for science resources on the TPT marketplace, and filter by grade level, price, and/or resource type to find materials that've been proven to work in classrooms like yours. No matter what you’re teaching, there are plenty of science lessons and activities sold by Sellers on TPT that are tailored to meet your students' skill levels.

How can I make my science lessons fun and engaging?

Students learn best when they're engaged! Sprinkle a little fun into your science lessons and make them feel like real scientists by investigating everyday objects, exploring the world outside the classroom, and doing hands-on and collaborative experiments and design challenges.