4 results
Earth sciences Common Core 8.F.B.4 resources
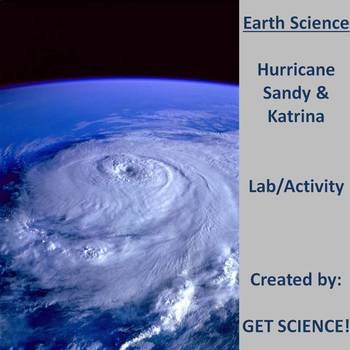
Tracking Hurricane Sandy!
This 6 page lab activity will help students remember where hurricanes form and why. The lab explores the differences and similarities between Hurricane Sandy and Hurricane Katrina. Students will practice their skill of plotting using latitude and longitude as they plot the tracks of both. The Saffir-Simpson scale will be used as students analyze data from both storms. Students will plot pressure vs. wind speed to understand the relationship and answer questions based on the data and general h
Subjects:
Grades:
7th - 12th
Types:
Human Population Graphing Lab
This simple yet effective lab allows students to strengthen their graphing skills using real word data. Students will deal with larger numbers as they see the exponential growth of the global population.Students will practice rate of change problems and scientific notation. Students will also make observations and inferences on their findings.You may edit this lab. Answer key and Graph Paper provided. Website for current world population in real time provided.Educating the World Together!
Subjects:
Grades:
6th - 12th
Types:
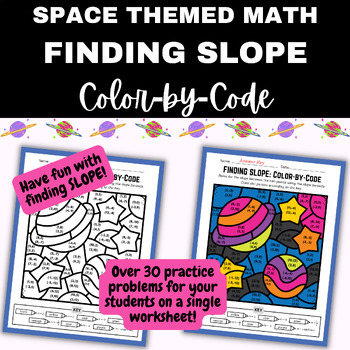
OUTER SPACE MATH Color by Code: Finding Slope Between Two Points
Looking for homework, classwork, workstations, or sub plans? This interactive math activity will reinforce your students' understanding of using the slope formula to find slope between two points(when given ordered pairs). This coloring worksheet will foster a sense of enjoyment, making math more approachable and less intimidating.This slope worksheet has an OUTER SPACE theme! There are over 30 problems on a color-by-number picture. The answer key is provided. Practicing finding the slope betwee
Subjects:
Grades:
7th - 10th
Types:
Also included in: FINDING SLOPE (USING FORMULA) Math Bundle 1: Color by Code
Recycling Rate: Algebra Application Investigation
This lesson applies algebra: graphing lines, systems of equations to a real-world scenario of waste production and recycling rates in the United States. Additional background info can be found: www.clearnair.org/waste/wastefacts.html and www.eia.doe.gov/kids/energyfacts/saving/recycling.htmlThis lesson combines a real-world issue with critical thinking and application of algebraic graphing. It ends with students brainstorming how they can make a difference now by reducing, reusing and recyclin
Subjects:
Grades:
7th - 9th
Types:
CCSS:
NGSS:
MS-ESS3-3
Showing 1-4 of 4 results

