1,878 results
4th grade statistics activities for International Baccalaureate
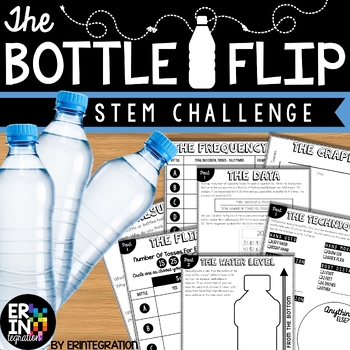
Water Bottle Flip STEM Challenge + STEM Activity
The ORIGINAL water bottle flip STEM activity and lab! Water bottle flip at school? Absolutely! Students will love this on-trend STEM challenge inspired by the popular YouTube water bottle flipping challenge where students toss a water bottle and attempt to land it straight up. Practice scientific method with some probability, fractions and data collection in the mix while having fun!This self-paced, low-prep, project based learning water bottle flip STEM challenge is print-and-go. Each activit
Subjects:
Grades:
3rd - 6th
Types:
CCSS:
NGSS:
K-2-ETS1-2
, K-2-ETS1-3
, MS-ETS1-2
, K-2-ETS1-1
, 3-5-ETS1-3
...
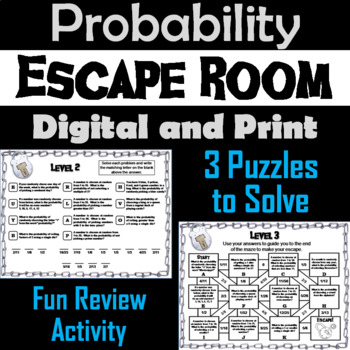
Simple Probability Activity: Escape Room Math Breakout Game
This breakout escape room is a fun way for students to test their skills with probability. Important: (How to Make Completely Digital)This product normally requires the printing of the questions to accompany a digital form for students to input answers. But if you follow a couple simple steps, this can be made entirely digital! Just use the following tool:https://smallpdf.com/split-pdf(choose "extract pages")to extract the pages containing the questions into its own PDF. You can then upload t
Subjects:
Grades:
4th - 6th
Types:
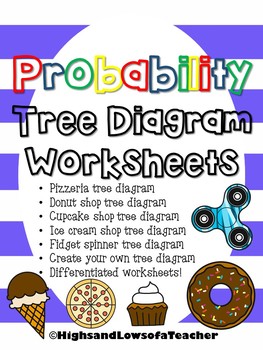
Probability Tree Diagram Worksheets
Use these tree diagram worksheets to help students learn all the outcomes (combinations) for probability unit.What's included-*Pizza toppings probability tree diagram*Donut probability tree diagram*Cupcake probability tree diagram*Ice cream probability tree diagram*Fidget spinner probability tree diagram*Create your own tree diagramAll worksheets come differentiated---one page that has tree diagram drawn in with some combinations already filled-one with tree diagrams drawn in-one blank page only
Subjects:
Grades:
3rd - 8th
Types:
Also included in: Probability Activity BUNDLE
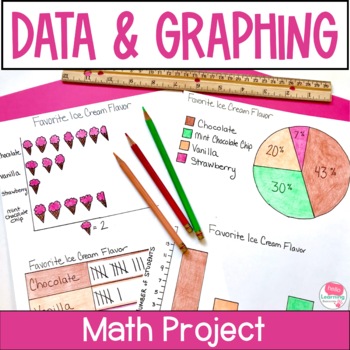
Data and Graphing Project - Real World Math Project Based Learning Activities
This data and graphing project gives your students a meaningful way to apply their data and graphing skills. Use this real world math project as an end of unit activity, enrichment activity or assessment. Easy to use and fun for students!Click the PREVIEW button above to see everything that is included in this fun math project!⭐ This resource includes:teacher information, directions and sample schedulesupply listgrading rubricstudent direction sheettwo data collection sheets (one for open ended
Subjects:
Grades:
4th - 6th
Types:
CCSS:
Blow Cup STEM Challenge and Scientific Method Project
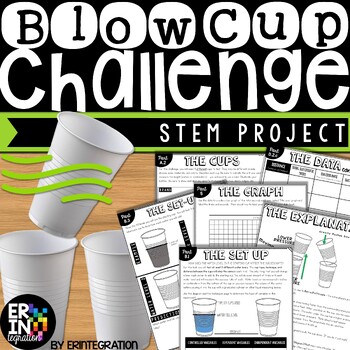
The Blow Cup Challenge is now a STEM activity with this engaging science project inspired by the viral video where students try to blow one cup into another cup. Great low-prep way to teach the scientific method, variables and review math skills!This self-paced, multi-part Blow Cup STEM challenge is print-and-go. Each activity sheet guides students through the project. STEM Challenge Overview:Students will use the included visual directions, graphic organizers, charts, and activities to...Deter
Subjects:
Grades:
3rd - 6th
Types:
NGSS:
MS-PS2-2
Create Your Own Survey: Collect, Organize, Graph, and Analyze Data
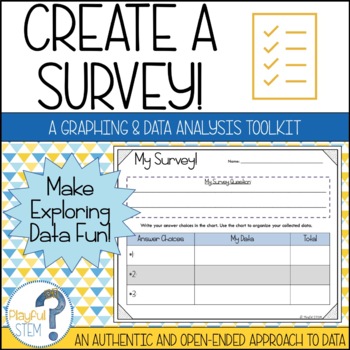
One of my best-selling TPT products -- now updated with a fresh look and new content!Teach Data Analysis the open-ended and engaging way -- through student-directed surveys!This resource pack is designed to help students follow the process of creating a survey: they will brainstorm questions, collect data, organize their obtained data, create multiple graphs to show their data, and then reflect on and analyze what their data tells them.The survey pack includes the following:Brainstorming Survey
Subjects:
Grades:
2nd - 5th
Types:
Skittles Candy with Mean, Median, Mode, Range, and Box and Whiskers Plot
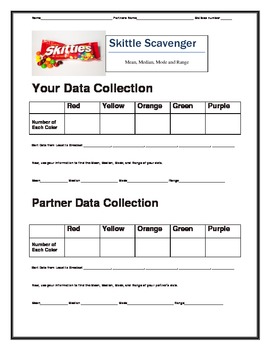
This is a quick, fun activity to use with statistics. I have the kids bring in a pack of skittles and sort by color. Then all of the kids will find the Mean, Median, Mode, Range, and Box and Whiskers.
Subjects:
Grades:
4th - 8th
Types:
Also included in: Statistics Unit
Dot Plot Worksheets
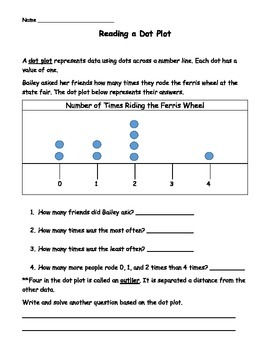
Students will read and create dot plots with these four worksheets. Students get experience interpreting data from dot plots as well as using vocabulary such as an outlier.
Two worksheets are reading a dot plot.
Two worksheets are creating dot plots from frequency tables including using a class survey of hours of sleep for data.
Answer key included for pages.
If you like this product, please rate me! I appreciate your feedback.
More math items can be found at my store, Always Love Learning.
Subjects:
Grades:
3rd - 6th
Types:
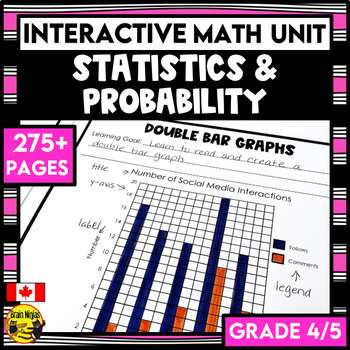
Statistics Graphing and Probability Interactive Math Unit | Grade 4/5
Stop searching for your statistics and graphing lessons. Everything you need to teach, practice, and assess bar graphs, pictographs, double graphs, stem and leaf plots and probability is included in this print-and-use unit. Your planning for your graphing unit is already done for you!This unit is part of the Full Year Interactive Math Unit Bundle for Grade 4/5. It comes with a bonus sequencing guide to help plan your whole year.This convenient resource includes:instructions for how to set up, as
Subjects:
Grades:
3rd - 5th
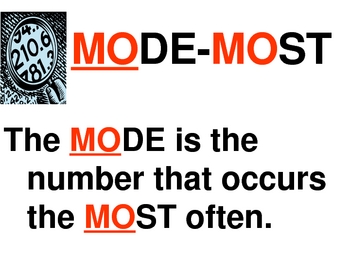
Statistics Mean, Median, Mode & Range Interactive PowerPoint by Erica
Introduce statistics including mean, median, mode and range with this colorful, interactive 22 slide PowerPoint. This interactive PowerPoint introduces each term and teaches a strategy for finding the value. There is also a trick or visual to help students remember the steps to find each one (mean, median, mode and range). Students are able to practice finding the mean, median, mode and range and then check within the PowerPoint. This is excellent for a statistics lesson or for students to e
Subjects:
Grades:
3rd - 6th
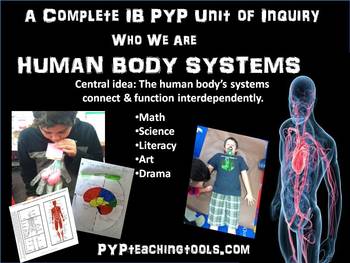
A Human Body Interactive Science IB PYP Unit of Inquiry
Flippables, foldables, 3d models, science experiments, research, transdisciplinary learning…….all in the name of inquiry based science. With over 170 pages, this 6 week, IB PYP unit of inquiry is looking at the human body and how our organs and systems are interdependent, together with how we compare to the systems that give life to other organisms. It is wholly differentiated with tasks marked A being more challenging than those marked B. It is suitable for grades 4-6. I have planned around t
Grades:
4th - 7th
Types:
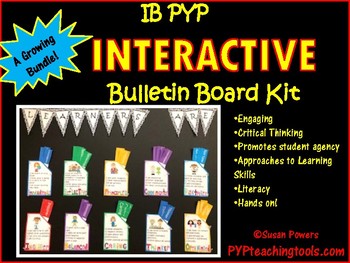
IB PYP Interactive Learner Profile Bulletin Board Kit
Promoting international mindedness, provoking critical thinking , looking at experiences close to home, personally and globally. This is an interactive IB PYP Learner Profile bulletin board! Print, laminate and hang the pockets onto your board and pick and choose the thought-provoking tickets that will go inside. This is a growing packet and will have additional tickets added all relaying to the Learner Profile. UK and USA spelling provided. Easy print, black and white option available for the
Grades:
3rd - 5th
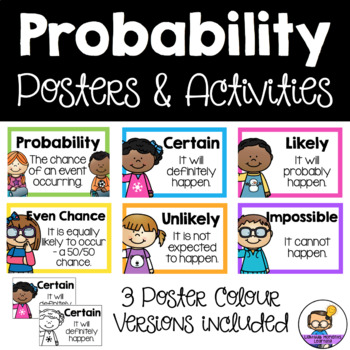
Probability Activities & Posters
It would be IMPOSSIBLE for you not to love these probability posters and activities! I am CERTAIN that these activities will be a fun addition to your classroom and provide a fun way to teach your students about probability.
This resource covers the terms Certain, Likely, Even Chance/Equally Likely, Unlikely and Impossible.
Posters included:
• Probability
• Certain
• Likely
• Even Chance (Equally Likely option included)
• Unlikely
• Impossible
Note: 3 colour versions included
Activities:
Subjects:
Grades:
1st - 4th
Types:
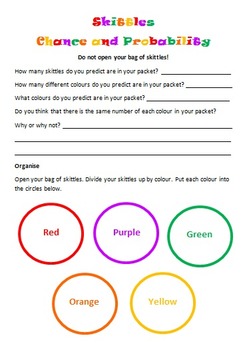
Skittles Chance and Probability (Editable)
Chance and Probability activity using yummy Skittles!!!
Students are to predict the colours and quantities before they open the skittles bag. Students are to complete a chance experiment where they use a tally to collect their data. Students then transfer their data in fractions, decimals and percentages. Students are to create a bar graph using their data as well as answer chance and probability questions about the data. I used this with my grade 5/6 students and they loved it!
Subjects:
Grades:
3rd - 10th
Types:
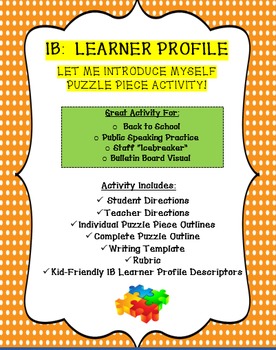
Back to School! Let Me Introduce Myself Puzzle Piece with MYP IB Learner Profile
This is a great icebreaker activity for the first week of school!
Students each receive a puzzle piece that they design and then present to the class. This is a great way for students to learn about each other and it also allows students the opportunity to work on their public speaking, not to mention it makes for a very awesome bulletin board display. Furthermore, there is also a writing component that goes with the puzzle so you can get a writing sample from each student as well in order
Grades:
K - 12th, Staff
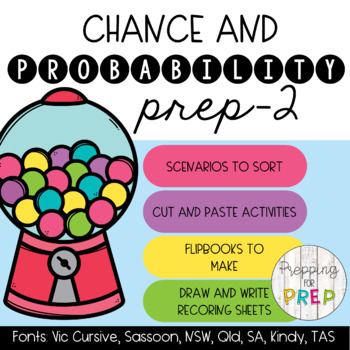
CHANCE AND PROBABILITY (FOUNDATION TO YEAR 2 ACTIVITY PACK)
This activity pack includes a variety of activities for you to use when teaching chance and probability using the language of will happen, might happen, will not happen and likely, unlikely and impossible. The resources include:Chance booklet where students cut along the dotted lines and draw and write about an event that will happen, might happen, will not happen (Or likely, unlikely, impossible). There are 7 font options and 1 with dotted thirds and one plain without lines to select from. What
Subjects:
Grades:
PreK - 4th
Types:
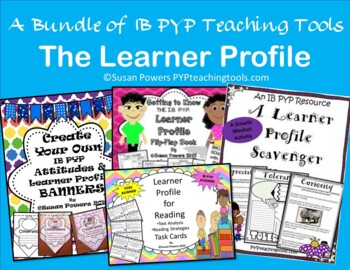
Back to School IB PYP Learner Profile Bundle of Activities
With the Learner Profile as the centre of the IB PYP, this bundled pack helps to develop necessary awareness of what each child's unique Learner Profile looks like. By understanding the attributes of a learner, the children are better equipped to identify their strengths and their challenges, enabling reflection, self-assessment and goal-setting. All of this leads to greater ownership and accountability for their learning. This is student agency! You will find a mixture of practical, hands-on
Grades:
3rd - 5th
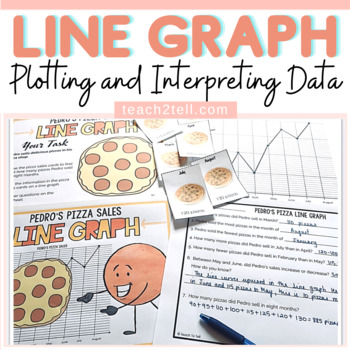
Line Graph Activity | Plotting and Interpreting Data on a Line Graph
Looking for a line graph activity that involves plotting and interpreting data on a line graph? Your students will enjoy this hands-on center activity that involves recording pizza sales over a given period using card visuals. They will get to plot and interpret data on a line graph.Items IncludedFile folder cover (2 options): if placing all items in a file at a centerSingle large task card (color and blackline) on a sheet outlining the taskTwo small task cards (color and blackline) on a sheet o
Subjects:
Grades:
2nd - 5th
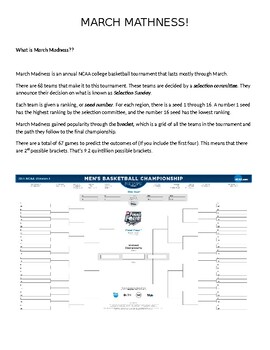
2024 March Mathness Madness NCAA Basketball Probability and Statistics Lesson
Every year I get my students excited about the NCAA Men's Basketball March Madness Tournament. I see articles written year after year from statisticians, sports journalist, celebrities, etc. about predicting the perfect bracket. Regardless that most have accepted it is nearly impossible, it has not deterred these enthusiast from finding an algorithm or a machine that can predict the outcomes.This packet guides students through 1) An explanation of what March Madness is all about2) A reading abou
Subjects:
Grades:
4th - 12th
Types:
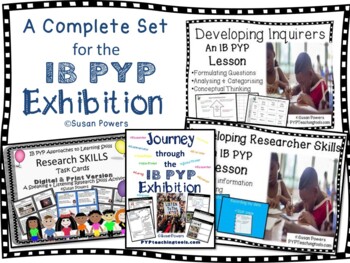
A Complete Set of IB PYP Exhibition Resources Distance Learning
Digital file included*The IB PYP Exhibition! The big event that is truly a journey of discovery for the children as they work their way through this valuable process, culminating in a final Exhibition; presenting their work over the past few months as well as show casing their growth and knowledge over the course of their PYP education. This bundle of resources is here to help you, dear teachers, as you embark upon this journey with them. It includes the best selling Journey Through the IB PYP E
Grades:
4th - 6th
Types:
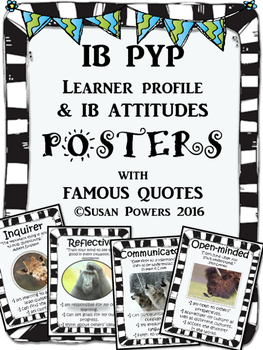
IB PYP Learner Profile and IB Attitudes Posters with Authors' Quotes Black White
*Digital file now included * Making the IB PYP meaningful and authentic. This set of classroom posters include language from the International Baccalaureate’s description of the Learner Profile and IB Attitudes. Each poster comes with endearing and funny pictures of animals, to help visualise the meaning behind the words and their kid friendly explanations. The quotes are from well known people from the past and the present and tie in wonderfully to further reinforce the students understanding.
Grades:
3rd - 6th
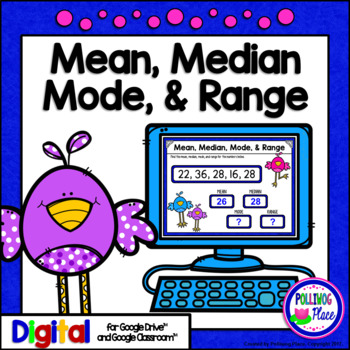
Mean Median Mode and Range - Statistics for Google Drive and Google Classroom
This Mean, Median, Mode, and Range data and statistics activity is designed for the interactive digital classroom using Google Drive (TM). Your students will practice finding the mean, median, mode, and range for sets of numbers.This activity set includes: * 20 slides for finding the mean, median, mode, and range * Student instruction slide * Getting started guide for teachers * Answer KeyThis is a low-prep activity that works with Google Drive (TM) and Google Classroom (TM). You wi
Subjects:
Grades:
4th - 6th
Types:
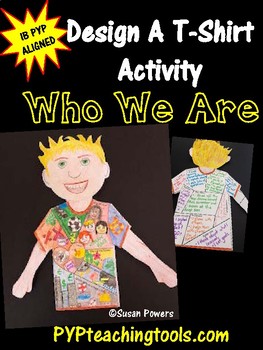
Back to School Who We Are IB PYP Design A T Shirt Activity
Getting to know your students with this self reflection activity is a win-win, as you encourage them to think critically about the questions in each section of their t shirt. Their thinking is recorded with drawings rather than simply written answers. The back of the t-shirt focuses specifically on Learner Profile and requires a written answer. Throw in some arts and crafts to create the head and shoulders as a self portrait and the final product is a beautifully colourful product that allows e
Grades:
3rd - 6th
Types:
Also included in: A Back to School Bundle of IB PYP Activities
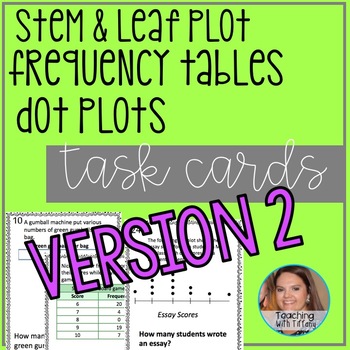
Stem and Leaf Plots, Frequency Tables, Dot Plot, Task Cards 2
This product contains 24 task cards dealing with stem and leaf plots, frequency tables, and dot plots. This is part 2 of my Stem and Leaf Plot, Frequency Table, and Dot Plot set. Part 2 was created to be slightly more difficult than Part 1. Part 1 was created for introduction, Part 2 is created for practice and requires different skills.
The students will need to have an understanding of:
Fractions (simplification)
Decimals (adding, subtracting, ordering)
Fractions (comparing)
Adding, Subtra
Subjects:
Grades:
4th - 6th
Types:
Showing 1-24 of 1,878 results

