7 results
Common Core HSS-ID.A.4 interactive notebooks for homeschool
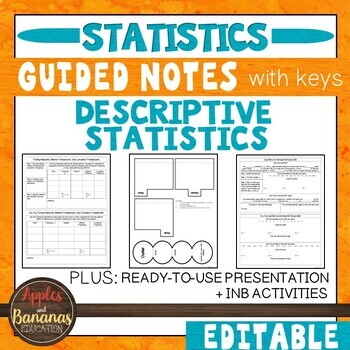
Descriptive Statistics- Guided Notes, Presentation, and INB Activities
This Introduction to Statistics product is flexible, editable, and can be used for in-person or distance learning. Take the time and stress out of creating your own guided notes and presentations. There are many ways to use this engaging bundle. It includes guided notes embedded with student practice problems (keys included), foldable activities, and a PowerPoint presentation for focused instruction. Choose what works best for your class/student and modify to make the content fit your needs. Not
Subjects:
Grades:
9th - 12th
CCSS:
Also included in: Custom Bundle for Viet
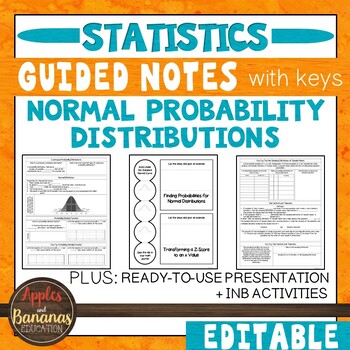
Normal Probability Distributions - Guided Notes, Presentation, + INB Activities
This Normal Probability Distributions (Statistics) product is flexible, editable, and can be used for in-person or distance learning. It includes guided notes embedded with student practice problems (keys included), foldable activities, and a PowerPoint presentation for focused instruction. Choose what works best for your class/student and modify to make the content fit your needs. Notes are designed to clearly present the topics and reach all types of learners. Take the time and stress out of c
Subjects:
Grades:
9th - 12th
CCSS:
Also included in: Custom Bundle for Viet

Normal Distribution Foldable Popup
This is a popup of a normal distribution graph, showing students the probable spread of data within 1, 2, 3, and 4 standard deviations of the mean. The formulas for the population standard deviation and the sample standard deviation are both included. It is a great reference/graphic organizer for student notebooks and I have even had students who weren't in my class ask to join because they wanted this popup too. Useful for math or maths class, great for visual and kinesthetic learners, and
Subjects:
Grades:
9th - 12th, Higher Education, Adult Education
CCSS:
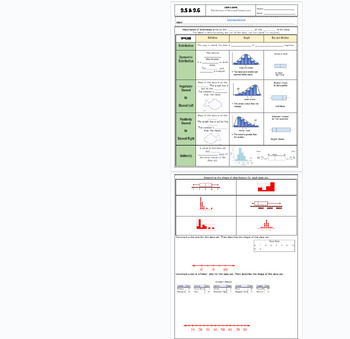
Data Distribution positive/negative skewed fillable notes UPDATED
Unit 9: Data and Stats: Updated(No 9.3/ Skip)9.5/9.6 Data Distribution (skewness)Students go over the vocabulary and complete the examples with the vocabulary scaffolded. Skewness is explained and how to identify it comparing data charts and box and whisker plots. Uses many visuals and examples to differentiate between that different graphs. Notes are scaffolded. Includes hook video hyperlinked on the "learning objective" title. Key is included and hyperlinked as a PDF in the heading highlighted
Subjects:
Grades:
6th - 12th, Higher Education, Adult Education
CCSS:
Also included in: Unit 9: Data and Statistics Fillable Notes
Standard Deviation Fillable Notes UPDATED
Unit 9: Data and Stats: Updated(No 9.3/ Skip)9.4 B Standard DeviationStudents go over the vocabulary and complete the examples with the vocabulary scaffolded. Standard deviation is long hand calculated by showing each step of the process (difference of squares). Real-world examples are explained in notes before calculating to show the importance of this stat and why it is used so often to verify valuable and effective data. Notes are scaffolded. Includes hook video hyperlinked on the "learning o
Subjects:
Grades:
7th - 12th, Higher Education, Adult Education
CCSS:
Also included in: Unit 9: Data and Statistics Fillable Notes
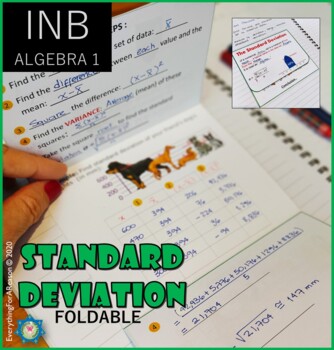
Standard Deviation Foldable
Standard Deviation FoldableThe best graphic organizer/foldable to teach standard deviation. Easy step by step, an aplicable example and attractive images! try it!Great addition for interactivenotebooks. This resource is part of Unit 11. Data Analysis and Displays Check the rest of this collection for Algebra 1 Foldables Bundle:Unit 1. PRE-ALGEBRA REVIEW FoldablesBundleUnit 2. SOLVING EQUATIONS FoldablesBundleUnit 3. SOLVING INEQUALITIES FoldablesBundleUnit 4. INTRODUCTION TO FUNCTIONS FoldablesB
Grades:
8th - 11th
Types:
CCSS:
Also included in: 8th Grade Math Interactive Notebook All-Year Curriculum PDF + EASEL
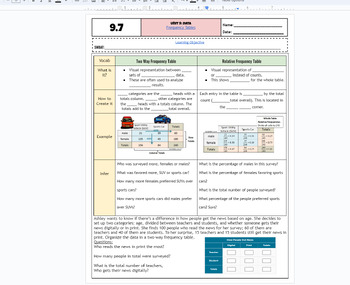
Frequency Tables & Relative Frequency Tables fillable notes UPDATED
Unit 9: Data and Stats: Updated(No 9.3/ Skip)9.7 Frequency Tables Students go over the vocabulary and complete the examples with the vocabulary scaffolded. Students examine a categorical table/frequency table and also use that information to create relative frequency tables. Different real-world examples and problems are used. Emphasized how percents and decimals are calculated. Notes are scaffolded. Includes hook video hyperlinked on the "learning objective" title. Key is included and hyperli
Subjects:
Grades:
6th - 12th, Higher Education, Adult Education
CCSS:
Also included in: Unit 9: Data and Statistics Fillable Notes
Showing 1-7 of 7 results

