10 results
Common Core HSS-ID.A.4 graphic organizers for homeschool
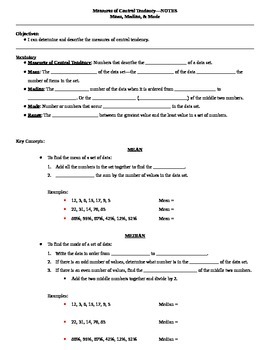
Measures of Central Tendency Guided Notes
These are guided notes for a lesson on measures of central tendency including mean, median, mode, and range. There are several examples in the notes and the same data sets are used to show each measure of central tendency.I have also included a teacher key to show you what to fill in the blanks as your students follow along.To use these notes, I simply projected them onto my whiteboard, gave the students their blank copies, and had them follow along and write what I wrote. This works great when
Subjects:
Grades:
5th - 12th
CCSS:

Normal Distribution Foldable Popup
This is a popup of a normal distribution graph, showing students the probable spread of data within 1, 2, 3, and 4 standard deviations of the mean. The formulas for the population standard deviation and the sample standard deviation are both included. It is a great reference/graphic organizer for student notebooks and I have even had students who weren't in my class ask to join because they wanted this popup too. Useful for math or maths class, great for visual and kinesthetic learners, and
Subjects:
Grades:
9th - 12th, Higher Education, Adult Education
CCSS:
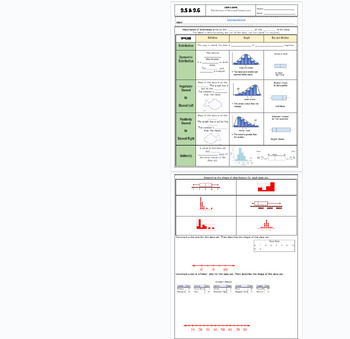
Data Distribution positive/negative skewed fillable notes UPDATED
Unit 9: Data and Stats: Updated(No 9.3/ Skip)9.5/9.6 Data Distribution (skewness)Students go over the vocabulary and complete the examples with the vocabulary scaffolded. Skewness is explained and how to identify it comparing data charts and box and whisker plots. Uses many visuals and examples to differentiate between that different graphs. Notes are scaffolded. Includes hook video hyperlinked on the "learning objective" title. Key is included and hyperlinked as a PDF in the heading highlighted
Subjects:
Grades:
6th - 12th, Higher Education, Adult Education
CCSS:
Also included in: Unit 9: Data and Statistics Fillable Notes
Standard Deviation Fillable Notes UPDATED
Unit 9: Data and Stats: Updated(No 9.3/ Skip)9.4 B Standard DeviationStudents go over the vocabulary and complete the examples with the vocabulary scaffolded. Standard deviation is long hand calculated by showing each step of the process (difference of squares). Real-world examples are explained in notes before calculating to show the importance of this stat and why it is used so often to verify valuable and effective data. Notes are scaffolded. Includes hook video hyperlinked on the "learning o
Subjects:
Grades:
7th - 12th, Higher Education, Adult Education
CCSS:
Also included in: Unit 9: Data and Statistics Fillable Notes
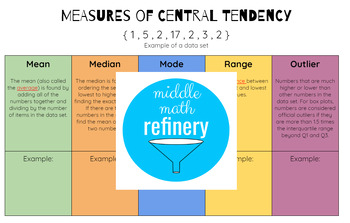
Measures of Central Tendency (Mean, Median, Mode, Range, Outlier)
This user-friendly resource is a great reference sheet for students learning about measures of center (mean, median, mode, range and outliers). Having tools like this to reference while working helps students to remember concepts and encourages self-reliance and ownership of own's learning. This resource works well in a graphic organizer and also word walls.Included: black and white printablecolor printableblack and white printable with answer keycolor printable with answer key
Subjects:
Grades:
6th - 10th
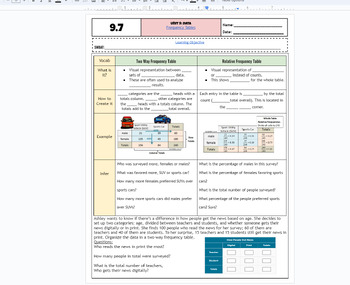
Frequency Tables & Relative Frequency Tables fillable notes UPDATED
Unit 9: Data and Stats: Updated(No 9.3/ Skip)9.7 Frequency Tables Students go over the vocabulary and complete the examples with the vocabulary scaffolded. Students examine a categorical table/frequency table and also use that information to create relative frequency tables. Different real-world examples and problems are used. Emphasized how percents and decimals are calculated. Notes are scaffolded. Includes hook video hyperlinked on the "learning objective" title. Key is included and hyperli
Subjects:
Grades:
6th - 12th, Higher Education, Adult Education
CCSS:
Also included in: Unit 9: Data and Statistics Fillable Notes
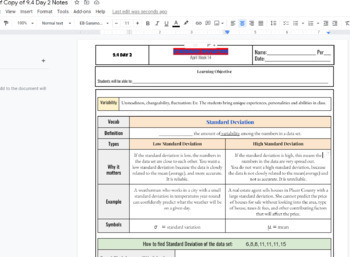
Standard Deviation Scaffolded Fillable Notes AND key
Standard Deviation Scaffolded Fillable Notes AND key, give definitions to the terms with real-world examples! Includes a video link in the notes as the intro to the lesson by describing the meaning and need for standard deviation in the simplest form possible! The key is linked at the top of notes as well that will download as a pdf- not a google doc- did not do the last problem on the bottom as it was an exit ticket for students (no layout).
Subjects:
Grades:
7th - 12th, Higher Education, Adult Education
CCSS:

Honors Algebra 2 Final Exam
This is a concept based final exam suitable for average to honors level Algebra 2 curricula. It follows basic common core skill sets and includes probability, number sets, standard distribution, and two-way tables but not trigonometry. I use it as an assessment for the students I home-school and study guide for students in public or private school settings. The first section involves matching graphs, key terms/skills, and parent equations to the various functions introduced in Algebra 2. The voc
Subjects:
Grades:
10th - 12th
CCSS:
Also included in: Algebra 2 Bundle

Distribution SOCS (Graphic Organizer)
When comparing and describing our boxplots, stemplots, histograms, dotplots, and other data displays it is vital that our students fully explain the differences and similarities in each distribution. SOCS (shaper, outlier, center, and spread) is a great acronym used to remember the four most important concepts that need to be discussed.This graphic organizer is a great tool to use as a warm-up or opener to a quiz or test. Or as an exit ticket to close our a lesson on comparing distributions.Al
Subjects:
Grades:
7th - 12th, Higher Education
CCSS:

Dr. Wimpey's Quick Reference for Statistics
I created this all-in-one document/foldable to help my statistics classes. It contains definitions, procedures, etc. It is useful for AP, honors, and CP levels in high school as well as college introductory statistics courses.
Subjects:
Grades:
11th - 12th, Higher Education
CCSS:
Showing 1-10 of 10 results

