24 results
Free statistics bulletin board ideas for parents
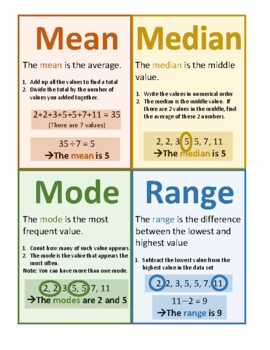
Mean Median Mode Range Poster Notes Anchor Chart
The PDF poster describes mean, median, mode, and range in an easy-to-understand and visual way. Enjoy!Check out my other posters here:STEM: Women in STEM Insp. Quotes, Women in STEM, Careers, Heroes Timeline, Inspirational Quotes from STEM HeroesABCs of Math: STEM Innovations, Amazing STEM facts, Careers, Shapes, in Nature Modern Style, in Nature Vintage Style, in Everyday LifeMath Vocabulary Alphabet: Elementary, Middle School, High SchoolMath in Art: Set A, Set B, Big BundleMath Modelling: Se
Subjects:
Grades:
5th - 9th
Types:
Mean Absolute Deviation Step-by-Step Posters FREEBIE CCSS 6.SP.5c Aligned**
Mean Absolute Deviation (MAD) can turn even the biggest math lovers into frustrated students without guidance. This topic is relatively new to the 6th Grade curriculum, so it can seem really daunting to teach as well! This free download gives step by step instructions (with examples) to make this math concept easier for you and your students! Perfect for a bulletin board, or to print multiple pages on a sheet (found in your Print settings) to include in a math notebook!
For use with CCSS 6.S
Subjects:
Grades:
6th
CCSS:
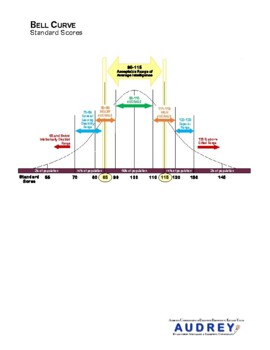
Special Education Evaluation Bell Curve SpEd Evaluation Diagnostician
Graphic to help explain standard scores to parents. See my other listings with the full version that contains information for parents.
Subjects:
Grades:
Not Grade Specific
Types:
IEP Tips and Testing Terms Defined - Free Chart
IEP Tips and Testing Terms Defined for Parents Free Chart: This freebie includes a page of tips for running a successful IEP meeting and another page that is a chart with the normal bell curve that defines different types of test scores. The scores defined are standard scores, stanines, percentile ranks, standard deviation, grade equivalents, age equivalents and composite scores. If you’d like to create your own chart like this check out my normal bell curve clipart package here!
You might al
Grades:
Staff
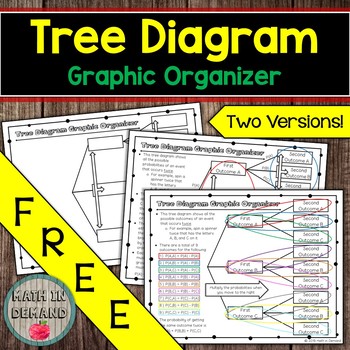
Tree Diagram Graphic Organizer
This Tree Diagram Graphic Organizer is FREE!!! It includes two versions: (1) Fill-in, or (2) Already Filled-in. There are many ways that you can use the graphic organizer. You can print and laminate, or have students glue in their math interactive notebooks.
Subjects:
Grades:
6th - 7th
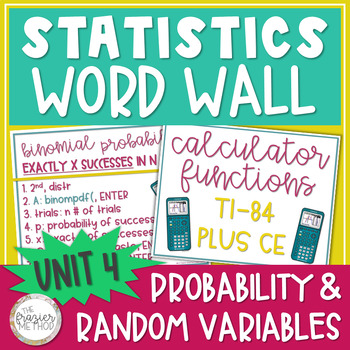
Statistics Word Wall Posters TI-84 Plus CE Calculator Geometric Binomial Unit 4
High school math classroom décor made easy with these 8.5" by 11" pages of PROBABILITY MODELS TI-84 PLUS CE CALCULATOR FUNCTIONS from Statistics! These can be displayed on any word wall or bulletin board in your math classroom or hallway. Put them up one at a time as you teach through each term or display them all at once. + 10 PAGES+ ALL PAGES ARE IN COLOR & GRAYSCALE.+ SIZE: 8.5 x 11 inches All vocabulary terms are from Unit 4: Probability & Random Variables, and the information on eac
Subjects:
Grades:
10th - 12th
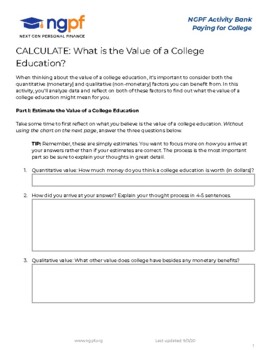
CALCULATE: What is The Value of A College Education?
Using research from the US Bureau of Labor Statistics, students will calculate the value of a college education. First, they will estimate its value. Then, they use a chart from the Dept. of Labor to calculate the value (in career earnings) of different levels of education. Finally they will reflect on that value. NGPF Activities teach your students key personal finance concepts while also honing their analytical skills.
Grades:
7th - 12th, Higher Education, Adult Education
Types:
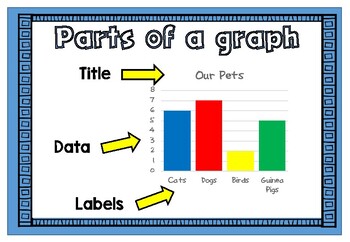

attention Subs may not leave campus early
Sub announcement for sub folders. Highly recommend printing on colored paper.
Subjects:
Grades:
Not Grade Specific
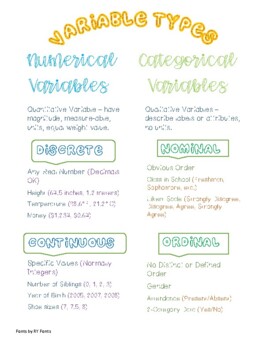
Variable Types
This is an anchor chart of the different Variable Types in Statistics. Numerical (Quantitative) Variables, Categorical (Qualitative) Variables; Discrete and Continuous and Nominal and Ordinal. The font is by RYFonts.
Subjects:
Grades:
11th - 12th
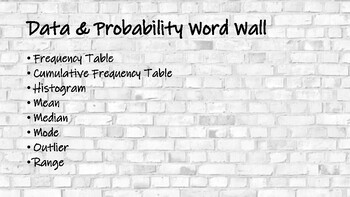
Data & Probability Word Wall
Print out these colorful vocabulary words to supplement your 6th Grade data and probability unit. Includes the following vocabulary words: Frequency Table, Cumulative Frequency Table, Histogram, Mean, Median, Mode, Outlier, Range
Subjects:
Grades:
6th
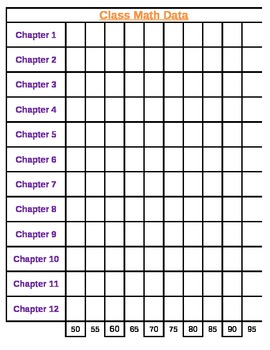
Math Class Data Sheet
Great for a class Data Wall!
This is an excel spreadsheet used to track yearly growth.
Enjoy!
Subjects:
Grades:
K - 12th
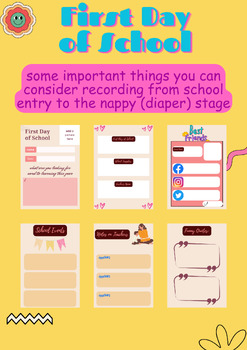
First Day of School
Remember that the key is to document things that feel significant to you and your child. These records will become cherished memories that you can look back on with fondness as your child grows up
Subjects:
Grades:
PreK - 9th

Common Core Standards for Measurement and Data for K-5
The Common Core Standards for Measurement and Data for K-5 are listed.
Subjects:
Grades:
K - 5th

Course Syllabus Template
This product is a Course Syllabus Template for you to edit and make your own. This template includes all important information students, parents/guardians, and administration need to know. In an organized manner, it covers the following areas:Course TitleTeacher Information (name, email, room number)General Course Information & ExpectationsCourse MaterialsTextbookCourse Topics/ScheduleExam ScheduleGrading PolicyGoogle Classroom/Remote Learning PolicyHomework PolicyTest/Quiz PolicyOffice Hour
Subjects:
Grades:
7th - 12th, Higher Education, Adult Education
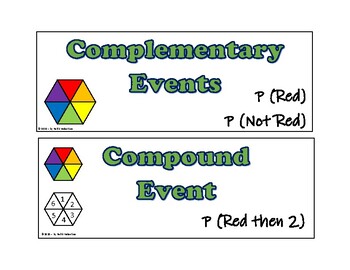
Types of Events in Probability
Word Wall Cards for five different types of events in probability. -Complementary Events-Compound Events-Dependent Events-Independent Events-Simple Events
Subjects:
Grades:
7th
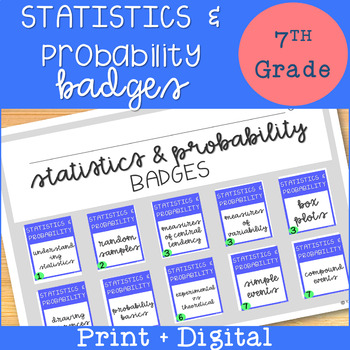
Learning Badges - Statistics & Probability 7th Grade
Gamify your math classroom with these free learning badges for 7th grade Statistics & Probability. These badges come in print and digital forms for both the online student, traditional student, or the home school student. Use formative assessment and feedback to guide your students to earning these standards based badges. The research suggests implementing digital badges can: Increase motivation Increase student learning outcomes Overall comprehensiveness of learningWhen you implement digita
Subjects:
Grades:
7th

Website Links (Mean, Median, Mode, Range) Tutorial Videos
This product contains 4 website links to Free Tutorial videos for you to show as a whole class or share with a small group of struggling students. Sometimes, seeing a lesson one more time really helps our visual learners. You could also send the links to parents by email and encourage them to watch them with their child so they may help their child with homework, studying, etc.This file includes 4 website links: Tutorial Video 1 Mean, Mode, Median Tutorial Video 2 Mean, Mode, Median Creatin
Subjects:
Grades:
5th - 7th
Types:
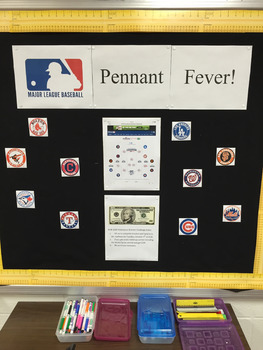
Pennant Fever! World Series Interactive Bulletin Board
This is an idea for a bulletin board using the MLB playoffs. Download the playoff bracket and print one for each student. I found mine on my MLB@Bat app on my iPad. You need to do this right away since the playoffs start the next day. Have each student predict who will win each round. Offer a cash prize for anybody who gets a perfect paper (don't worry...there is a 1/512 chance of a perfect paper).
Display and update the papers as the playoffs progress.
Math ideas we discussed:
-After the firs
Subjects:
Grades:
6th - 12th
Types:

Winter Olympic Games Scorecard
Keep track of the 2014 Winter Olympics in Sochi Russia with this event scorecard bulletin board idea. Print out the cards and have students keep track of the medals won in each event. Great geography or Data management application.
Subjects:
Grades:
4th - 8th
Types:
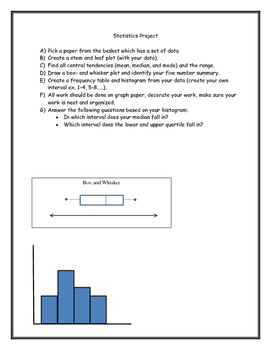
Statistcs Project
This project is designed for students to represent data in various statical representations.
Subjects:
Grades:
9th
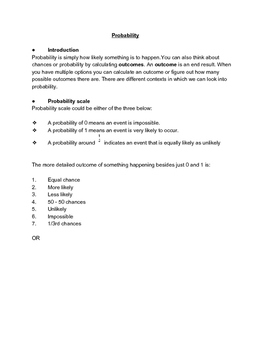
Probability
What is probability, probability scale, types of probability depending on various factors , calculating probability using tree diagram, problem statements.
Subjects:
Grades:
K - 2nd
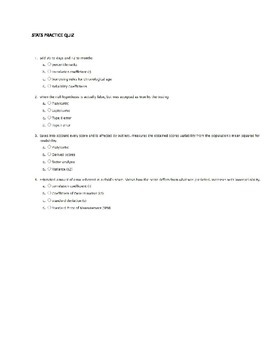
Educational Statistics practice quiz
goes along the powerpoint and provides additional practice with understanding the basic terminology used in special educational testing.
Subjects:
Grades:
Higher Education, Adult Education
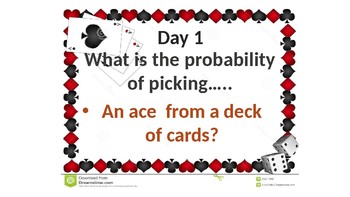
Probability- Card Edition
This is a great interactive bulletin board idea for math! There are 5 days, each day has a different probability question using playing cards. There is even a bonus day for extra credit!
Subjects:
Grades:
7th - 8th
Types:
CCSS:
Showing 1-24 of 24 results


