41 results
7th grade graphing Common Core 4.MD.B.4 resources
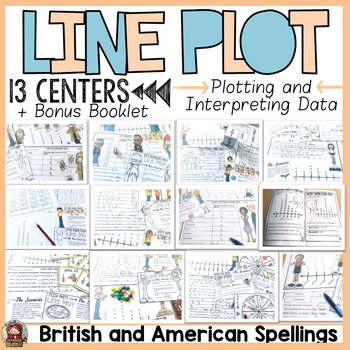
Line Plots With Fractions and Whole Numbers
Interpreting data in Line Plots with fractions and whole numbers feature 13 center interactive activities. Students will work with fractions of a unit and whole numbers to collate and display data using interactive materials like visual cards, dice, spinners, candy, coins, and other real-life data. Items Included13 center Activities (color and blackline): for each center activity students will follow the instructions on a task card to plot data on a line plot and interpret data plotted on a resp
Subjects:
Grades:
3rd - 7th
Types:
Interpreting Graphs for the Middle & Junior High School: Book 2
Here is another set of data graphics for your students to analyze and interpret. Using survey results from the USA Today newspaper, students will be asked to explain what the graphics are illustrating. Each activity will ask the student to identify basic information presented in each graphic and make some projections based on the data given in the survey.
The activities in this packet are a great way to improve your student’s skills in taking apart graphic displays of information. Brin
Subjects:
Grades:
4th - 10th, Adult Education
Types:
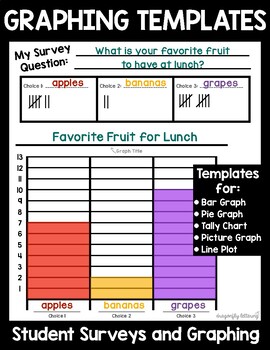
Graphs & Survey Templates - Conduct a Survey, Create Graphs, Analyze Data
Graphing and Survey TemplatesAligns with K-5 CCSS for Measurement and DataThese worksheets can be used YEAR ROUND! Students love giving surveys and gathering information from their classmates. Graphing and analyzing data is an important skill that develops across grade levels.This file includes:2 Introductory Bar Graph Surveys4 Bar Graph TemplatesA blank template to use for Line Plots, Picture Graphs, Bar Graphs, etc.4 Tally Graph Templates1 Pie Chart TemplateGraphing QuestionsEach graphing temp
Grades:
K - 8th
Types:
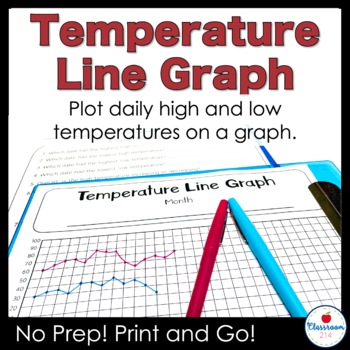
Weather Temperature Graph with Data Analysis Questions
Graph daily high and low temperatures on a line graph. At the end of the month, use the data analysis questions to promote critical thinking about temperature trends and practice graph reading skills. A perfect a weather unit, bell ringer or morning work assignment to sharpen math, earth science, and data analysis skills. WHAT'S INCLUDEDFahrenheit graph (-20 - 100 degrees Fahrenheit)Celsius graph (-20 - 40 degrees Celsius)Seven data analysis questions to be completed at the end of the monthAD
Subjects:
Grades:
2nd - 8th
Types:
NGSS:
3-ESS2-1
, MS-ESS2-5
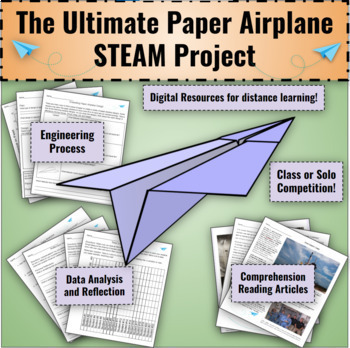
The Ultimate Paper Airplane STEAM Project: 10 Day Engineering Design Challenge
Every year since I started teaching, I've done a paper airplane contest. When I first started around 10 years ago, it was a quick contest that lasted just a few minutes. Gradually, as my experience as an educator grew, this project began to grow into what it is today... A 10 day cross-curricular mega project! I always say that student engagement is the key to learning, and I can almost guarantee that your students will be engaged during these activities! They will be measuring, graphing, reading
Subjects:
Grades:
3rd - 8th
Types:
NGSS:
3-5-ETS1-3
, 3-5-ETS1-1
, 3-5-ETS1-2
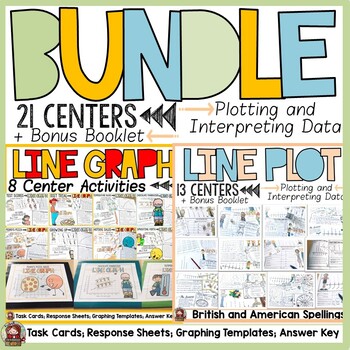
Line Graphs and Line Plots With Fractions and Whole Numbers Centers Bundle
Line Graphs and Line Plots with fractions and whole numbers feature interactive center activities. Data is collected using concrete materials such as visuals, dice, spinners, coins and other real-life objects and contexts. Further details about the graphs featured in this bundle are:1. LINE GRAPHSThis is a 145 page unit on Line Graphs that contains visual interactive activities to collate, record and interpret data in line graphs. Items Included8 center Activities (color and blackline): for eac
Subjects:
Grades:
3rd - 7th
Types:
Super Bowl Math - 2024 Edition
UPDATED for 2024!New - Bundle includes original Superbowl Math templates and Superbowl Math Cheat Sheets / Quick Version. Also new, Superbowl Timeline template.Target Grade Levels: 4-8 gradeTired of the same old data probability activities involving flipping coins and rolling a number cube?Try using a real-life application using a subject that get students, especially boys, interested in math!Have your students use real-life data/ stats to make a prediction about the Super Bowl winner!Students
Subjects:
Grades:
4th - 8th
Types:
Types of Graphs Flippable and Memory Game
As a review before our test on data and graphs, I had my students put together a timeline flippable with details about the 7 different types of graphs that we had learned about and been using. Within each flippable the students attached the pre-typed definition to go along with the flippable and then wrote examples of when to use each type of graph.
To review further, I split the students into small groups and gave them each a set of the Types of Graphs Memory Game. This way they had to match t
Subjects:
Grades:
4th - 7th
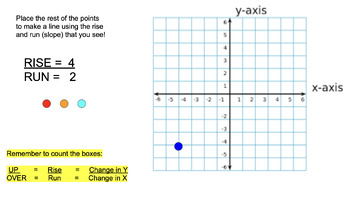
Coordinate Plane, Slope, Rise/Run, Graphing - Online No Prep Bundle
A bundle of activities which can be used as formal lessons or independent practice. Great for Google Classroom or Smart-boards! Also can be used as sub plans! Created by a Special Education Math Teacher to help students become comfortable with graphing!
Grades:
5th - 12th
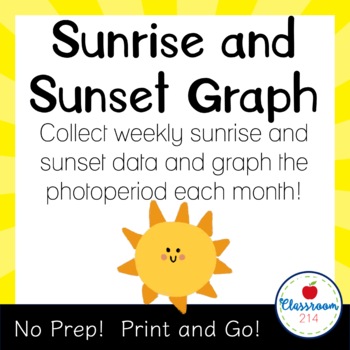
Sunrise and Sunset Photoperiod Graph Track Amount of Daylight
Collect weekly data on the sunrise and sunset times and create a bar graph with the average monthly photoperiod information. Includes a one-page description of why the amount sunlight changes and how it is connect to the seasons.This No Prep! Print and Go! activity takes just minutes each day and targets so many key science and math skills! Use the one-page description of why seasons and daylight change to fix a common misconception about what causes Earth's seasons and the changes in the am
Subjects:
Grades:
3rd - 8th
Types:
CCSS:
NGSS:
MS-ESS2-6
MATH GRAPHS & DATA Introduction to Various Graph Types PowerPoint PPT
This is a 36-slide PowerPoint presentation that provides the following information:
1. graphing vocabulary (data, scale, axis, interval, range, outlier);
2. definitions of and examples of 8 types of graphs (bar graph, double bar graph, line graph, line plot, stem-and-leaf plot, circle (pie) graph, pictograph, and histogram); and
3. a practice slide (with an answer slide to follow) for each type of graph.
Enjoy!
Deanne Davis, MCPSS
Subjects:
Grades:
3rd - 9th
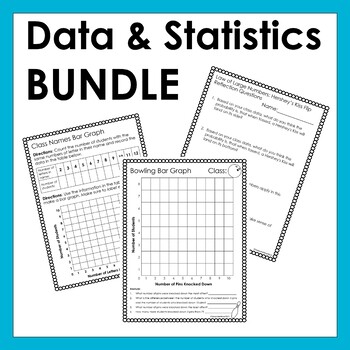
BUNDLE:Graphing, Probability, Data Collecting Activities/Stations Middle School
7-Activity/Station Data Day This download includes seven different data and statistics activities. These activities promote math group discussions, team work, and creativity in mathematics and great for students who are visual and hands on learners. Activity #1: Name Bar GraphsTeach your students about bar graphs by creating a class wide bar graph using your student’s names. This download provides directions as well as student work pages to graph the names of their classmates. Needed Materials
Subjects:
Grades:
5th - 8th
Types:
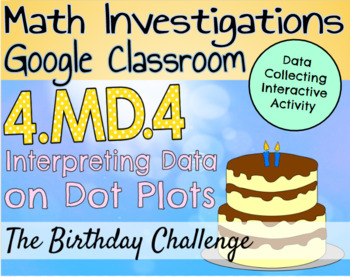
4.MD.4 Dot Plots Activity: The Birthday Challenge
This free digital resource is an interactive activity where students gain real world experience collecting data and interpreting it on dot plots. (4.MD.4)Skills practiced in this activity:Collecting dataGraphing data on a dot plotUsing data to answer questionsFor additional questions, please email me at hannah.buckley@jefferson.kyschools.us.Follow my store, https://www.teacherspayteachers.com/Store/Jewells-For-The-Fourth-Grade for more resources!
Subjects:
Grades:
4th - 8th
Types:
CCSS:
Types of Graphs Graphic Organizer
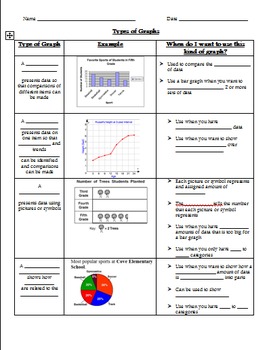
Multiple graphic organizers included. Students explore various types of graphs and learn about the characteristics and advantageous traits of each type, including line plot, histogram, line graph, circle graph, bar graph, stem-and-leaf plot, and double line graph. There are two types of graphic organizers included. The first is a basic graphic organizer that can also be used as an assessment in which students just identify the type of graph. In the second graphic organizer, students fill in key
Grades:
3rd - 7th
Mathematics in Nature {CCSS Math and NGSS Aligned}
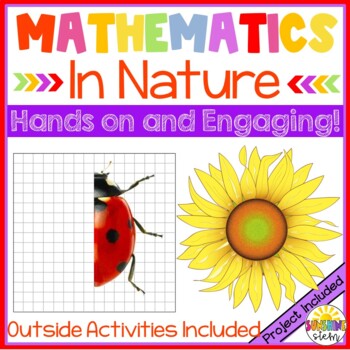
Students explore and apply the principles of mathematical patterns in nature in a fun and engaging way! First, students identify and describe patterns in the natural world before heading outside to find patterns on their own. Next, students begin to explore number patterns in nature using the Fibonacci sequence. Fin fingerprint activity keeps students interested and engaged! Next, explore cycles in nature by creating a model on paper using 3-dimensional objects. Rubric included. Students are
Grades:
4th - 7th
Types:
Mean, Median, Mode, and Range | Math Task Cards 50% SALE!
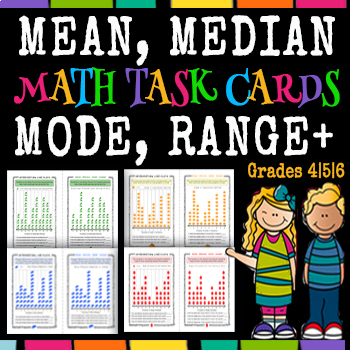
Hello! Do you need an amazing Mean, Median, Mode and Range Mega Bundle? Are you seeking fun, relevant and meaningful graph worksheets that engage students? This is a great 2-in-1 math resource! The resource combines Mean, Median, Mode, Range questions using fun Line Plot Graphs for learners to enthusiastically measure data using whole numbers. The resource includes editable student worksheets that is great for Distance Learning! REVIEW! "This product is a great value for practicing mean, med
Subjects:
Grades:
4th - 7th
Types:
Types of Graphs Posters
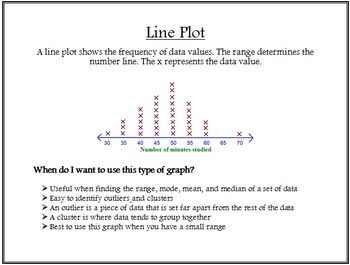
Students will explore a variety of different types of graphs and learn about the characteristics and advantageous traits of each type. These posters include the following types of graphs: bar graph, line graph, pictograph, circle graph, line plot, histogram, stem-and-leaf plot, and double line graph. You can display these posters in your classroom for student reference. You can also download my free product named "Types of Graphs Graphic Organizer" and use the posters to help students explore th
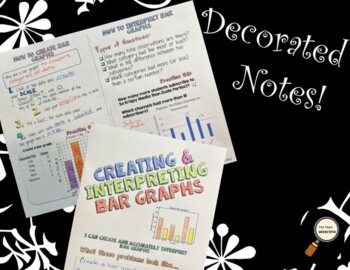
Creating and Interpreting Bar Graphs - Decorated Notes Brochure for INB
Excited to try Decorated notes but need a product that will fit inside your interactive notebooks? Then Decorated Note Brochures are perfect for you! Research shows that students who sketch, color, or doodle while listening to instruction tend to have better recall. These Decorated Note Brochures combine coloring, note taking, examples, and creative visual triggers to help students remember mathematical concepts. Being able to correctly create graphs and use them to analyze data is a necessary s
Grades:
4th - 8th
4.MD.4 Dot Plots Activity: Paper Airplane Challenge
This resource is an interactive whole class activity where students gain real world experience collecting data and interpreting it on dot plots. (4.MD.4)This product includes two parts:An interactive google slides presentation with an engagement hook and guiding questions.Student data collecting sheet and dot plot organizerTeacher Instructions are also included in this resource to help facilitate an entire lesson.Skills practiced in this activity:Collecting dataGraphing data on a dot plotUsing d
Subjects:
Grades:
4th - 8th
CCSS:
Line Graph Assessment: scale, labels, interpreting, continuous vs. discrete data
This activity uses data from a realistic scenario (a bike ride) to assess students’ graphing and interpreting skills when working with line graphs.Assesses if students can:- determine a reasonable scale- create and properly label a line graph- explain how data was collected- differentiate between discrete and continuous data- interpret a line graph- draw reasonable conclusions from a set of data- identify information between data pointsAn answer key included for easy marking out 20 points!This p
Subjects:
Grades:
4th - 8th
Types:
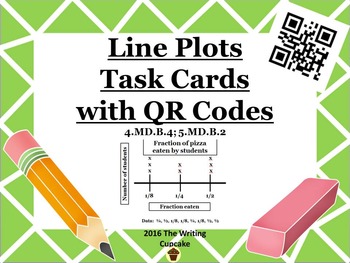
Line Plot Task Cards with QR Codes 4.MD.B.4; 5.MD.B.2
This pdf contains...
4 full page line plots
4 individual task cards per line plot (16 total)
16 corresponding QR code answer cards (which can be printed separately or on the back of the question cards to allow students the opportunity to self check their answers)
1 student response sheet
1 teacher answer key
Subjects:
Grades:
3rd - 7th
Types:
Probability, Patterns, Graphs, and Equations Mini-unit BUNDLE
Probability and Patterns Worksheets and Study Guide including determining the likelihood of an event, representing probability as a number, creating models or practical problems to represent probability, and patterns found in objects, pictures, numbers, and tables. Correlated with 2016 VA SOL 4.13 and 4.15 and CCSS 4.OA.C.5 and 7.SPC.5. The calculator symbol indicates that the problems in this unit will appear on the section of the Grade 4 Virginia SOL Math test that allows a calculator. I
Subjects:
Grades:
3rd - 7th
Line Graph Worksheets
This packet allows for students to get practice analyzing, interpreting, and creating line graphs. Each page comes with a key to make grading simplified. Please review this product and let me know what you think!

Drop Zone: Parachute Design Project-Based Learning Lab
This highly adaptable investigation will engage students of many ages and levels. Options for primary, upper elementary, and middle school are included. This is a true STEM lab that incorporates the science, technology engineering, and math components. Common, inexpensive, and easily available materials make this an easy lab to teach yet it produces maximum learning and engagement in your classroom. NGSS and Common Core Math Standards alignment are included in this "STEM on a Shoestring Budget"
Subjects:
Grades:
1st - 8th
Types:
Showing 1-24 of 41 results


