30 results
Free graphing Common Core 4.MD.B.4 resources

Penguins Line Plots Math Pack 2nd 3rd 4th 5th Grades Common Core
Looking for a fun, differentiated way to teach your students about graphs - specifically line plots? Need something to capture their interest this winter? How about penguins! This special math freebie is super flexible - it can be used in 2nd grade all the way through 5th Grade. Super easy to differentiate for different ability levels, too! The teacher completely controls what kinds of numbers are used for the line plot: whole numbers only, whole numbers and fractions, fractions only. The
Grades:
2nd - 5th
Types:

FREE Line Plot Template
Line Plots: Line Plot templateFree printable line plot page with tally chart and line plot template. Click here for the third grade Measurement and Line Plot unit. Click here for the second grade Measurement and Line Plot unit. Christine CadalzoCopyright 2012-2023All Rights Reserved.
Grades:
2nd - 5th
Types:

Line Plots with Fractions Interactive Notes Activity
These line plots with fractions interactive notes are perfect for your 5th-grade math classroom! Students will learn how to read a line plot, display data on a line plot, and redistribute data on a line plot using guided math practice and real-world math examples.Students will learn: The definition of a line plotHow to create a line plotUsing fractions with unlike denominators in a line plotThis resource is INCLUDED in my Line Plots Unit***********************************************************
Subjects:
Grades:
4th - 6th
Types:

4.MD.4 Dot Plots Activity: The Birthday Challenge
This free digital resource is an interactive activity where students gain real world experience collecting data and interpreting it on dot plots. (4.MD.4)Skills practiced in this activity:Collecting dataGraphing data on a dot plotUsing data to answer questionsFor additional questions, please email me at hannah.buckley@jefferson.kyschools.us.Follow my store, https://www.teacherspayteachers.com/Store/Jewells-For-The-Fourth-Grade for more resources!
Subjects:
Grades:
4th - 8th
Types:
CCSS:
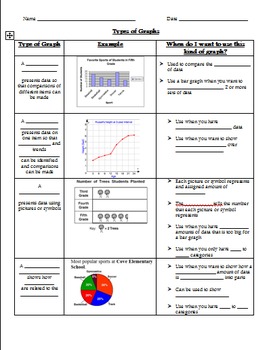
Types of Graphs Graphic Organizer
Multiple graphic organizers included. Students explore various types of graphs and learn about the characteristics and advantageous traits of each type, including line plot, histogram, line graph, circle graph, bar graph, stem-and-leaf plot, and double line graph. There are two types of graphic organizers included. The first is a basic graphic organizer that can also be used as an assessment in which students just identify the type of graph. In the second graphic organizer, students fill in key
Grades:
3rd - 7th
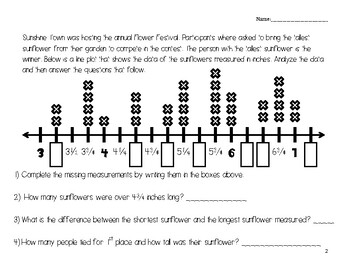
Fraction Line Plot
Needing to do a quick review on fractions or line plots?? This resource calls students to analyze data on a line plot while also exploring the relationship between measurements and fractions in mixed number form. I have also used this resource to address misconceptions in my small math groups. It's fast and can be accomplished within the small group time window! Questions scale from DOK Level 2-4! Font Credits: Hello Font
Subjects:
Grades:
3rd - 5th
Types:
Valentine Candy Hearts: Fractions and Data Analysis
Conversation Hearts are the perfect manipulative to reinforce concepts of fractions, decimals, and percentages. Created by Tried and True Teaching Tools, this math lesson also puts data analysis and graphing into action!
Subjects:
Grades:
4th - 6th
Types:
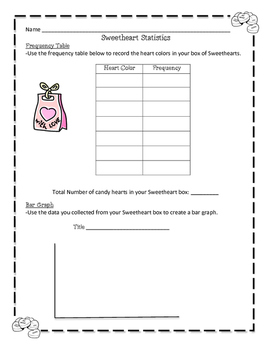
Valentine's Day Graphing
Teach line plot, frequency tables, and bar graphs using a box of conversation hearts for Valentine's Day.
*Each student will need their own box.
First, students will collect data from their individual box of conversation hearts to create a frequency table and bar graph based on the color of hearts in their box. Next, students will collect class data to create a frequency table and a line plot based on the number of candy hearts in their box.
Subjects:
Grades:
2nd - 5th
Types:
Line Plots
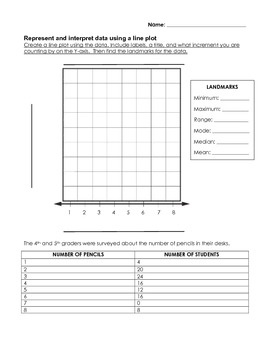
This is 5 pages of line plot practice that includes creating the line plot, using increments on the y-axis, labeling the x-axis and y-axis, giving the graph a title, and finding the landmarks (minimum, maximum, range, mode, median, and mean).
Grades:
3rd - 6th
Types:
CCSS:
Candy Line Plot Graphing Activity
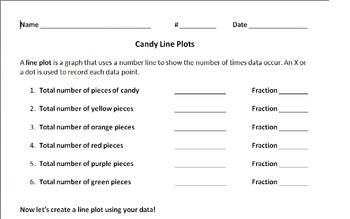
Great way to introduce students to line plots! I used Skittles, but you can use any other candy with the same colors. Helps students practice writing fractions, identifying wholes, finding equivalent fractions, and creating line plots. Plus, they get to eat candy!
Directions:
1. Give all students the same number of pieces of candy, but make sure that it will easily break into fractions (e.g., 12).
2. Have students count the number of pieces of candy they have and figure out the fraction for th
Subjects:
Grades:
4th
Types:
CCSS:
Data and Graphing Project Freebie
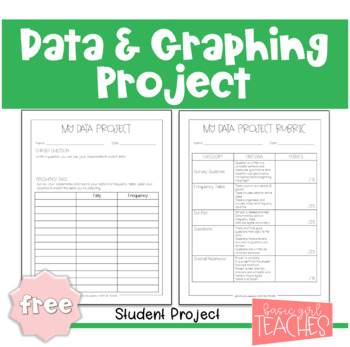
My greatest challenge with teaching students about graphing and data is helping them make real world connections. It’s easy to make a graph about things they’ve heard of before, but it’s tricky to demonstrate how they can use data outside of the classroom. I’m still working on refining my instruction in this area, but implementing this data and graphing project in my classroom has helped. My students get excited about graphing and data and start to make connections across multiple representation
Subjects:
Grades:
3rd - 4th
Types:
Also included in: 4th Grade Math Activities TEKS Aligned Bundle
Smartie Maths FREE Fractions, Decimals and Percentages
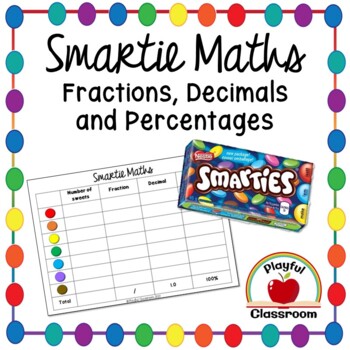
This is a fun and easy activity that is guaranteed to engage your students. Simply give each student a box of mini smarties and explore how many of each colour is in their boxes. They can then work out the fraction, decimal and percentage of each colour using the chart included.Did you know that every time you leave a review, you earn credits to use on future TPT purchases? Every review you leave is really appreciated by the seller.Make sure to Follow Me so you know when I post new products.If
Subjects:
Grades:
4th - 6th
Types:
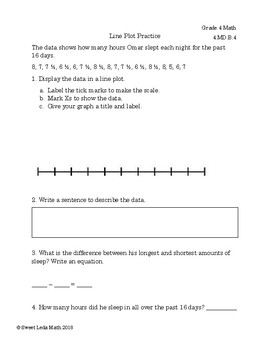
Line Plot Practice 4.MD.B.4
Real-world worksheet involving a line plot with fractional units. A few problem-solving items are included.
Subjects:
Grades:
4th - 6th
4-5 Fractional Line Plot Worksheets
This product includes 2 fraction line plot worksheets. The worksheets contain data tables that must be used to create a line plot, followed by questions that relate to the table that use other skills relating to fractions. This file would be most useful as a review, center or small group activity, early finisher choice or morning work.
Subjects:
Grades:
4th - 5th
Types:
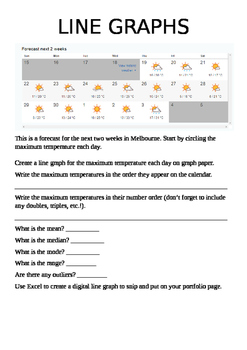
Line Graph Practice
This worksheet provides students with questions about mean, median, mode, range and outliers to answer about a data set, and then guides them through drawing the corresponding line graph by hand. It also suggests using Excel to create a line graph for use in an e-Portfolio.
This aligns with the Australian National Curriculum standards as follows:
Year 4 (extension to) ACMSP095
Year 5 (extension) ACMSP118 and ACMSP119
Year 6 (extension) ACMSP147
Year 7 ACMSP172
Subjects:
Grades:
4th - 7th
Types:
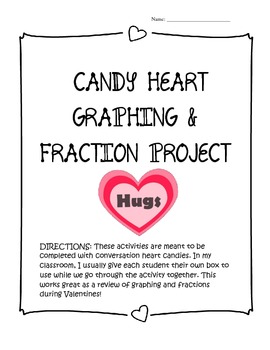
Candy Heart Math Activities
These two activity pages are meant to be used with boxes/bags of conversation hearts. The skills covered include: creating bar graphs, line graphs, line plot, and pictographs; also fractions, fractions on a number line, adding fractions, and probability. A fun way to review skills during a Valentine's Day unit! Graphics provided by © Laura Strickland/MyCuteGraphics.com.
Subjects:
Grades:
4th
Types:

What Graph Would You Use? A Cut and Paste Math Worksheet
What Graph Would You Use is a cut and paste activity that can be used as interactive notes for a math journal or as a formative assessment at the end of your graphing unit. This math worksheet focuses on bar graphs, line graphs, circle graphs, and line plots. This product includes two versions of the What Graph Would You Use sheet so you can pick the one that best fits how you will use it in your classroom! Students will cut and glue the included cards matching an example of and the purpose of e
Grades:
3rd - 5th
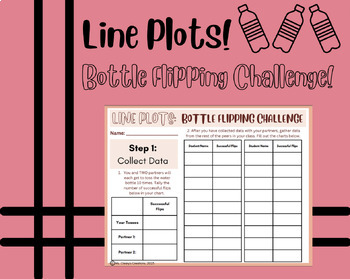
Line Plots Activity
This hands-on activity will be sure to bring some energy and excitement into your classroom! Included are four pages of organized charts, directions, and questions for your students to answer!
Grades:
3rd - 5th
Types:

Decimal Racing With Number Lines
Take your students outside and race! Use these worksheets to generate number lines and answer questions based on race times.Skills Included:DecimalsLine plotsLeast and greatestMedianModeRangeOutliers
Grades:
3rd - 5th
Types:
CCSS:

City of Vancouver Water Consumption Line Graph - Differentiated Assignment
In this assignment, students will create a single line graph to illustrate the City of Vancouver’s water consumption from 2006 to 2015. This package includes: Real data from the city of VancouverStudent handouts with instructions and graph paper Discussion questionsAnswer key/sample graphAssessment rubric The water usage data for this assignment ranges between 480 and 583 litres per person per day, so this activity provides a great opportunity to introduce the concept of an axis break on the y a
Grades:
4th - 8th
Types:
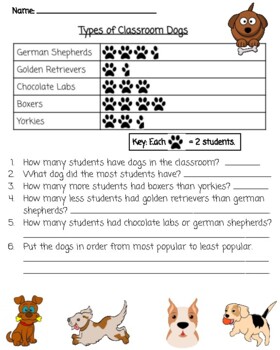
Pictograph With Questions
Students will look at a pictograph of dogs and answer questions about it.
Subjects:
Grades:
2nd - 4th
Types:
Birthday Estimation Jar
This math resource offers an alternative to birthday cupcakes or other treats and was created out of a push for health and wellness for children. The birthday child fills an estimation jar with prizes and asks an estimation question about his/her items. He/she then collects class responses and graphs the data in either a line plot or a bar graph made on chart paper. This activity has many extension and possibilities and can be quick (10 minutes) or lengthy (20 to 25 minutes) depending on teacher
Subjects:
Grades:
K - 5th
Types:
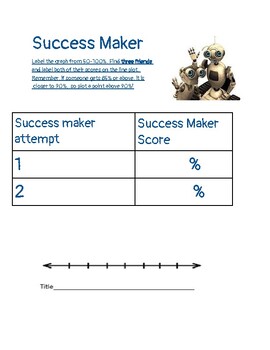
Success Maker Data- Line Plot Activity
Do you want your students to be accountable? This is a great activity for Student engagementMovementResponsibilityLine Plot Practice
Subjects:
Grades:
2nd - 5th
Types:
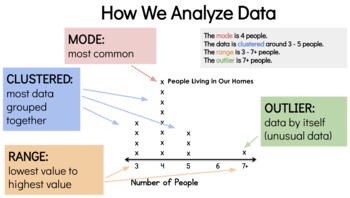
How We Analyze Data Anchor Poster
Here's an easy and clear way to teach vocabulary terms (mode, clustered, range, outlier) used to analyze data in graphs. I reference this anchor poster during my whole graphing unit and the kids respond very well to it! Before you know it, you'll have them regularly using these terms to talk about data!
Subjects:
Grades:
2nd - 5th
Types:
CCSS:
Showing 1-24 of 30 results


