193 results
12th grade statistics independent work packets
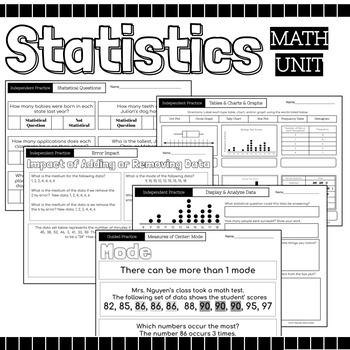
Statistics Math Packet {Data, Charts, Graphs, Mean, Median, Mode, Range, Spread}
52 Page Statics Unit Includes: Guided Instruction & Independent Practice Pages Usage Suggestions and IdeasThis resource can be utilized in numerous ways, here are some ideas:use for guided practiceassign as partner workassign as independent practicecan be used for morning workuse for reteaching in small group settinguse as review prior to assessmentuse as review in continuing to strengthen skillassign for homeworkuse as independent work during math centersTopicsRecognize Statistical Question
Subjects:
Grades:
4th - 12th
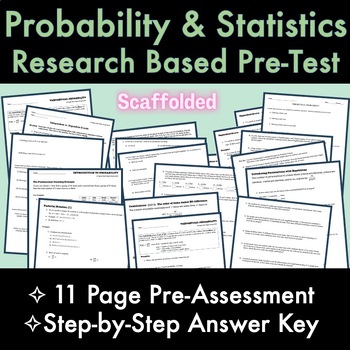
Statistics & Probability RESEARCH BASED 11-Page PreTest/PreAssessment with Key
87 qualified high school math teachers have been surveyed POST-COVID across the 6 subjects (algebra 1, algebra 2, geometry, precalculus, calculus, and statistics & probability). This 11-page research-based scaffolded statistics & probability pretest/ pre-assessment/ common assessment is a compilation of their answers to the question: what do you WISH students knew BEFORE taking the course? The assessment is scaffolded for students as well!---------------------------Check out my other res
Subjects:
Grades:
11th - 12th, Higher Education
CCSS:
Also included in: ALL HIGH SCHOOL MATH SUBJECTS Full PreTests with Keys - RESEARCH BASED
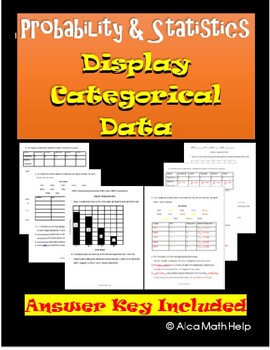
Categorical Data Display Pie Chart & Bar Chart: Worksheet, CW, HW CP & AP Stats
If you are looking for an easy to follow for students. You are at the right place. This is a quick and easy to follow activity sheet that brings across the concept clear and precise. Teachers in my department love this activity sheet. This is useful of CP Probability and Statistics, AP Statistics and Algebra 1 statistics unit. Categorical data and Display Variables ObjectivesAt the end of the lesson students should be able to:1. Correctly define categorical and quantitative data with examples2.
Subjects:
Grades:
8th - 12th, Higher Education, Adult Education, Staff
AP Statistics - 147 Google Form Companions for ALL AP Daily Videos
Do you require your students to watch the awesome AP Daily videos that College Board provides? Me too! But I needed a way to ensure the students were actually watching this resource and taking away all the valuable information they contain. These Google Forms allowed me to confirm that students were making the most of the AP Daily videos.This download contains 147 google forms. Each form is a companion to the 147 AP daily videos located in the AP Statistics course for all units from 1-9.
Subjects:
Grades:
9th - 12th
CCSS:
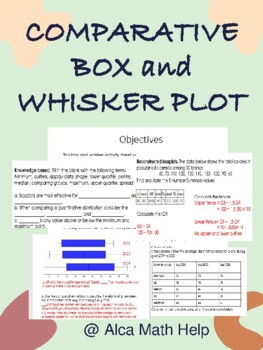
Comparison Box and Whisker Plots Worksheet, Quiz, Test for Stats & AP Stats
This box and whisker activity sheet was designed to test students understanding of the 5 number summary data values given quantitative data sets. Perfect for students in grade 10-12 doing statistics and you want to give them a challenge and should be manageable for students doing AP STATSAt the end of this activity students should be able to1. Students should be able to explain and construct box plots showing the different regions and what they represent. 2. Students should also be able to use
Subjects:
Grades:
11th - 12th, Higher Education, Adult Education, Staff
CCSS:

MEANS AND VARIANCES OF A RANDOM VARIABLE
Means and Variances of a Random VariableIn this lesson, students will learn:▪ how to apply the rules for sums or differences of means of two separate distributions or repeated trials from a single distribution▪ how to apply the rules for sums or differences of variances of two separate distributions or repeated trials from a single distribution
Subjects:
Grades:
10th - 12th, Higher Education
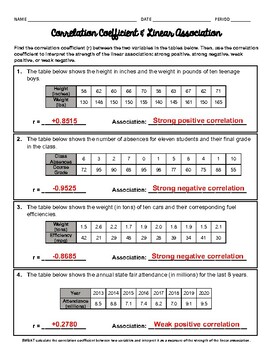
Correlation Coefficient and Linear Association Worksheet
8 question worksheet on using technology to find the correlation coefficient, and use it to determine the strength of a linear association (strong positive, strong negative, weak positive, or weak negative). #1 - 8 given a table in context of real-world problems, use technology to find the correlation coefficient (r) between the two variables. Then use r to determine the strength of the linear association. Answer key included.VISIT US AT WWW.ALMIGHTYALGEBRA.COM FOR MORE RESOURCES AND BUNDLED DIS
Subjects:
Grades:
8th - 12th
CCSS:

KEY | MEANS AND VARIANCES OF A RANDOM SAMPLE
Means and Variances of a Random VariableIn this lesson, students will learn:▪ how to apply the rules for sums or differences of means of two separate distributions or repeated trials from a single distribution▪ how to apply the rules for sums or differences of variances of two separate distributions or repeated trials from a single distribution
Subjects:
Grades:
10th - 12th, Higher Education
KEY | How Does Stratifying Improve on a Simple Random Sample?
How Does Stratifying Improve on a Simple Random Sample? In this lesson, students will learn:what is meant by an unbiased estimator or statistichow to simulate a simple random samplehow to simulate a sample proportionhow to simulate a stratified random sample.the difference between bias and variation.
Subjects:
Grades:
10th - 12th, Higher Education
Unit Test/Quiz/Packet- Two-way table, Venn diagram, Conditional Probability
If you are looking for an easy to follow for students. You are at the right place. This is a quick and easy to follow activity sheet that brings across the concept clearly and precisely. Teachers in my department love this activity sheet. This is useful for CP Probability and Statistics, AP Statistics and Algebra 1 statistics unit.5W’s and How of statisticsAt the end of the lesson students should be able to:1. Recall the history of statistics2. Define the 5W’s and How of statistics with example
Subjects:
Grades:
9th - 12th, Higher Education, Adult Education, Staff
CCSS:

Do Heavier Cars Use More Gasoline?
In this lesson, students will learn:to create a scatterplot and a linear regression line on a graphing calculator.to assess how linear the data points are and how useful a linear regression will be.to create and interpret a residual plot.to make predictions using the regression line, distinguishing between extrapolations and interpolation
Subjects:
Grades:
10th - 12th, Higher Education

ARE ALTITUDE AND PRECIPITATION INDEPENDENT?
In this lesson, students will learn:to create and interpret a two-way tableto calculate "or" probabilities, "and" probabilities, or conditional probabilities— the "given" type, by reading a two-way table, or by applying one of the basic probability formulas.to viscerally decide if two events are independent--viscerally because they have not yet learned the Chi-square test of independence.
Subjects:
Grades:
10th - 12th, Higher Education

How Much TV Do College Students Watch?
In this lesson, students will learn:how to perform all the steps of a confidence intervalhow to perform all the steps of a significance testhow to predict the outcome of a two-tailed significance test by using the corresponding confidence interval
Subjects:
Grades:
10th - 12th, Higher Education
How Does Stratifying Improve on a Simple Random Sample?
How Does Stratifying Improve on a Simple Random Sample?In this lesson, students will learn:what is meant by an unbiased estimator or statistichow to simulate a simple random samplehow to simulate a sample proportionhow to simulate a stratified random sample.the difference between bias and variation.
Subjects:
Grades:
10th - 12th, Higher Education

KEY | Do Heavier Cars Use More Gasoline?
In this lesson, students will learn:to create a scatterplot and a linear regression line on a graphing calculator.to assess how linear the data points are and how useful a linear regression will be.to create and interpret a residual plot.to make predictions using the regression line, distinguishing between extrapolations and interpolation
Subjects:
Grades:
10th - 12th, Higher Education

KEY | ARE ALTITUDE AND PRECIPITATION INDEPENDENT?
In this lesson, students will learn:to create and interpret a two-way tableto calculate "or" probabilities, "and" probabilities, or conditional probabilities— the "given" type, by reading a two-way table, or by applying one of the basic probability formulas.to viscerally decide if two events are independent--viscerally because they have not yet learned the Chi-square test of independence.
Subjects:
Grades:
10th - 12th, Higher Education
Data and Statistics Review: Measures of Center, Dot and Box Plots, and More
This Data and Statistics Review Packet is perfect for Statistics students or anyone doing SAT Math prep. Included Types of Data Representations:Distance vs. time graphBar graphDouble bar graphLine graphBoxplotScatterplot with and without a best fit lineDot plotThis is the figure and graph analysis chapter from my book "Overcoming Digital SAT Math" by Sophia Garcia. It contains 45 mostly SAT-style math questions. Bundle and save by getting my entire Digital SAT Math Workbook or just get my SAT ma
Subjects:
Grades:
9th - 12th
Also included in: SAT Math Prep Workbook for Digital SAT

KEY | How Much T.V. Do College Students Watch?
In this lesson, students will learn:how to perform all the steps of a confidence intervalhow to perform all the steps of a significance testhow to predict the outcome of a two-tailed significance test by using the corresponding confidence interval
Subjects:
Grades:
10th - 12th, Higher Education

Statistics & Probability
Two documents include questions and related vocabulary terms. The other two documents are the related answer keys.
Subjects:
Grades:
10th - 12th, Higher Education
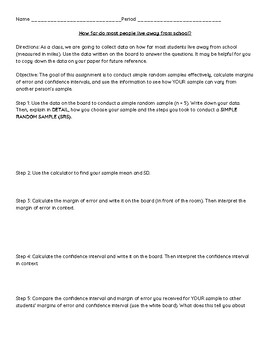
Margin of Error and Confidence Intervals Class Activity: Statistics
Hi! If you're looking for an interactive class activity on margin of error and confidence intervals, this is a fun and engaging 1-2 hour long activity you can do with your student. It will require students to collect data and use the data to create their own confidence intervals. Feel free to edit the document as you need. I've used this assignment as an open quiz/class quiz and/or exit ticket before. Please do not distribute or post this resource publicly. Thank you!
Subjects:
Grades:
10th - 12th
CCSS:
BUNDLE: Intro to Probability & Theoretical Probability LESSONS, PACKETS, KEYS
➤ LESSON 1: Intro to probability full 2 to 3-day GUIDED-NOTES lesson packet, 40 total exercises (can be used as classwork and/or homework), notes and step-by-step answer keys. What is the Fundamental Counting Principle? Definition and connection to Sample Space and Tree Diagrams. What is permutation vs. combination, and when do we use them? Students learn what a factorial is through flawless connections to fundamental counting principle and permutations, and how to simplify factorials without us
Subjects:
Grades:
9th - 12th
CCSS:

Cell Cycle/Mitosis Scenario with Chi-Square Analysis
What's better than a cell cycle and mitosis review? A cell cycle and mitosis review that also has students complete a chi-squared analysis of data!Students will run through a lab-based scenario to help review the steps of the cell cycle and mitosis. They will also been given data based on this scenario and complete a full chi-squared analysis, including null and alternate hypotheses, using the chi-square critical values table, completing the calculations for chi-squared, and reaching a conclu
Subjects:
Grades:
10th - 12th, Higher Education, Adult Education
Also included in: Cell Cycle/Mitosis and Chi-Squared Analysis Activity and Answer Key
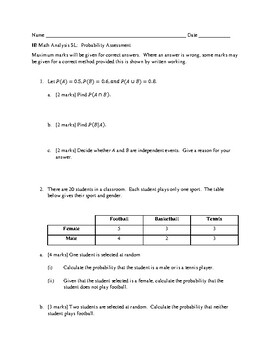
IB Math AA SL: Probability Assessment with Answer Key
This 37-mark, 6-question assessment contains Paper 1 style probability questions asking students to:determine whether events are independentfind the union/intersection of two events use a two-way table to find probabilities, including conditional probabilityfind the probability of two independent eventsfind probabilities of mutually exclusive eventsdraw a tree diagram and use the diagram to calculate probabilities
Subjects:
Grades:
11th - 12th
CCSS:
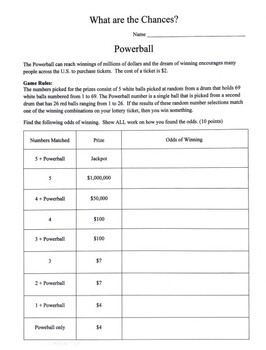
What are the Chances?
Calculate the odds of winning every prize in the Powerball lottery and the Megamillions lottery by using combinations. Determine the amount you will receive after taxes.
Subjects:
Grades:
10th - 12th
Showing 1-24 of 193 results


