7 results
Graphing Common Core 4.MD.B.4 graphic organizers
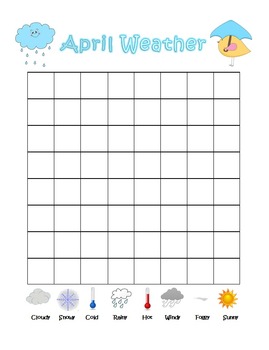
Monthly Weather Graph Charting ***BUNDLE***
This bundle includes weather graphs for September through June! Teach kids to graph using daily weather with these fun weather graphs! Graphics are tapered to monthly themes, they are great for grades K-5.
Subjects:
Grades:
K - 5th
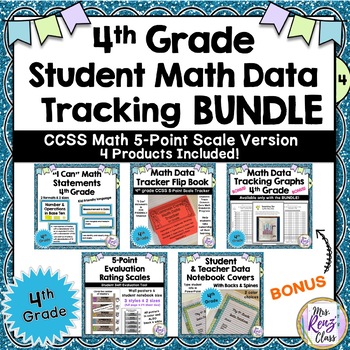
4th Grade Math Student Data Tracking Bundled Set (Common Core 5 point scale)
Help your students track their own mastery of the CCSS-M standards with this Common Core math data tracking Bundle that includes 5 products and 170 pages of materials. "I Can" statements are included, as are a folded data tracker, data binder tracking sheets, 5-point self evaluation rating scales and data binder covers. >>> This set uses a 5-point rating scale. <<<Here's the 3-point scale version of this data tracking bundled set.Here's the 4-point scale version of this data t
Subjects:
Grades:
4th
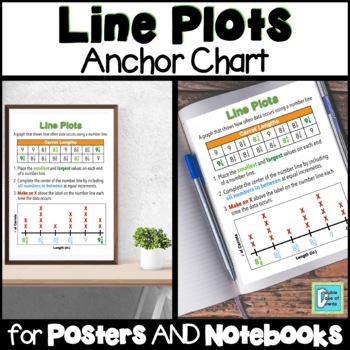
Line Plots Anchor Chart Interactive Notebooks & Posters
This anchor chart for line plots shows students a visual example as well as the definition and instructions on how to use data from a table to create a line plot. We prefer to keep anchor charts simple and neat so as not to overwhelm our students and to keep them focused on essential information. This is a one-page anchor chart that comes in a variety of formats including a single sheet, half sheets (great for interactive notebooks), and a 2x2 POSTER. The poster will print on 4 sheets of paper
Subjects:
Grades:
4th - 6th
CCSS:
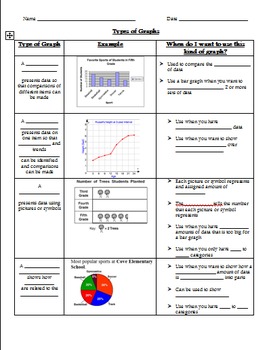
Types of Graphs Graphic Organizer
Multiple graphic organizers included. Students explore various types of graphs and learn about the characteristics and advantageous traits of each type, including line plot, histogram, line graph, circle graph, bar graph, stem-and-leaf plot, and double line graph. There are two types of graphic organizers included. The first is a basic graphic organizer that can also be used as an assessment in which students just identify the type of graph. In the second graphic organizer, students fill in key
Grades:
3rd - 7th
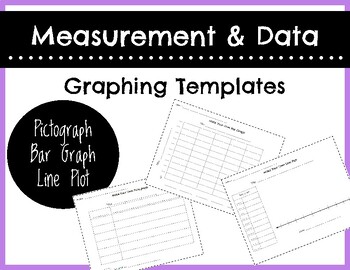
Graphing Templates
Check out these graphing template worksheets! Included in your purchase are templates for the following types of graphs:pictographbar graphline plotAlso included in your purchase is a digital copy so you can edit these templates to match your curriculum!
Grades:
K - 5th
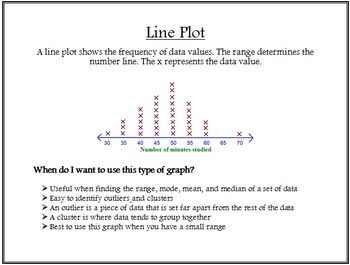
Types of Graphs Posters
Students will explore a variety of different types of graphs and learn about the characteristics and advantageous traits of each type. These posters include the following types of graphs: bar graph, line graph, pictograph, circle graph, line plot, histogram, stem-and-leaf plot, and double line graph. You can display these posters in your classroom for student reference. You can also download my free product named "Types of Graphs Graphic Organizer" and use the posters to help students explore th
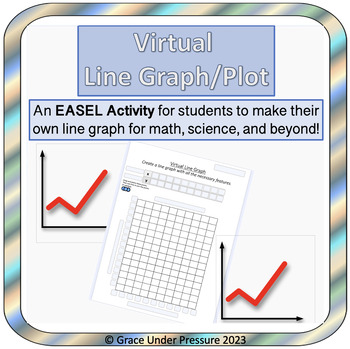
Virtual Line Graph or Scatter Plot Template: EASEL ONLY
This product is a virtual (EASEL) line graph or scatter plot template that can be used for graphing data from math, science, social studies, psychology, or other subjects.You can type in the ordered pairs ahead of time, or you can have your students type them into the (x,y) chart. Then, they have to use the ordered pairs to make a line graph or scatter plot:• Type in a title• Label x & y axis• Choose an appropriate scale and enter it on each axis• Drag and drop the circles as data points• Us
Subjects:
Grades:
Not Grade Specific
Showing 1-7 of 7 results


