20 results
Graphing Common Core 4.MD.B.4 posters
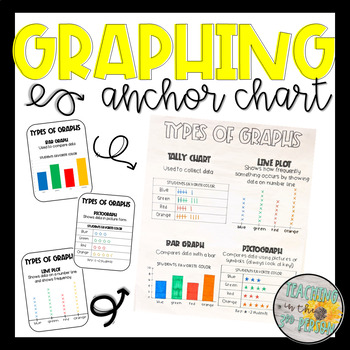
Types of Graphs Anchor Chart - Tally Chart, Bar Graph, Pictograph, Line Plot
Graphing made easy!Use these templates as a guide in creating your own anchor charts or print and use them in other helpful ways:Trace and create an anchor chart with studentsPrint on bright colored paper and use as postersShrink down and glue in student' math notebooks for a reference sheetPrint and send home as reference tools for students and parents (homework or tutoring)Earn Credit for Future Purchases:I appreciate each & every word of your valuable feedback. Also, if you leave feedback
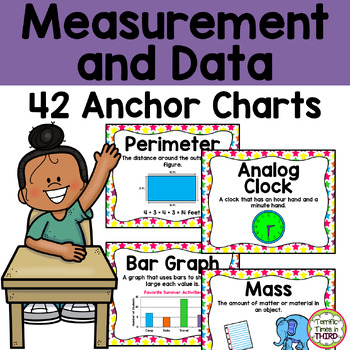
Measurement and Data Anchor Charts and Posters
These 42 anchor charts will provide students with the concepts and vocabulary used with measurement and data. Each anchor chart is full page size - 8.5 x 11 inches. There is no prep work, just print and go!These posters are perfect for a classroom bulletin board, focus wall, math centers, or as student handouts. These charts come in color and black & white to best fit your needs. Print and display these charts to give a vibrant and informative visual for students that can be used year after
Subjects:
Grades:
1st - 4th
Also included in: Math Anchor Charts and Posters Bundle
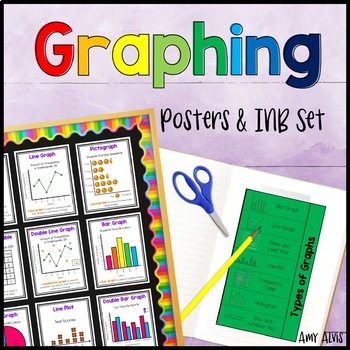
Graphing Posters & Interactive Notebook Bar Graph Picture Graph Line Plot
This poster or anchor chart and interactive notebook (INB) set includes FOURTEEN posters covering bar graphs, double bar graph, pictographs, picture graph, line graphs, double line graph, line plot, circle graphs, frequency tables, sector graph, stem and leaf plots, histograms, dot plots, parts of a graph and box and whisker plots. This set also includes SIX different foldable interactive notebook (INB) pages (that you print and put into a paper notebook) for students to take notes as well as a
Subjects:
Grades:
2nd - 5th
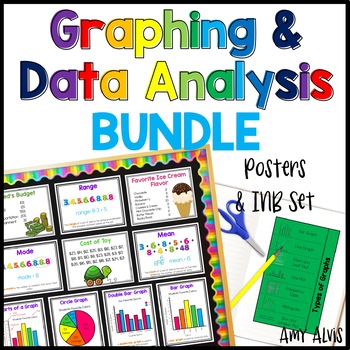
Graphing and Data Analysis Bundle Posters Interactive Notebook INB Anchor Chart
This bundle includes my Graphing Poster and Interactive Notebook (INB) set, my Data Analysis Poster and Interactive Notebook (INB) set and my Data Posters and Cards. Make sure to check the links below to see what comes with each set.This bundle includes:1. My best selling Graphing - Poster and INB Set.This poster and interactive notebook (INB) set includes FOURTEEN posters covering bar graphs, double bar graph, pictographs, picture graph, line graphs, double line graph, line plot, circle graphs
Subjects:
Grades:
2nd - 6th
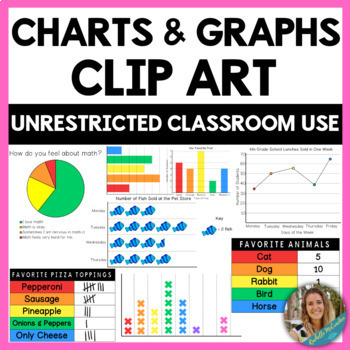
Charts and Graphs Clip Art, Math Clipart
This charts and graphs clip art set is a perfect addition to your math clip art collection! The download includes 19 .png files. Use the clip art in the following ways:Demonstrate how the charts and graphs are used by showing your class the premade examplesUse the partially finished charts and graphs to change out the information but not have to change the images.Use the black chart and graph templates to completely customize the information to fit your needsThe following types of charts and gra
Subjects:
Grades:
K - 5th
Also included in: Lower Elementary Math Clip Art Bundle!
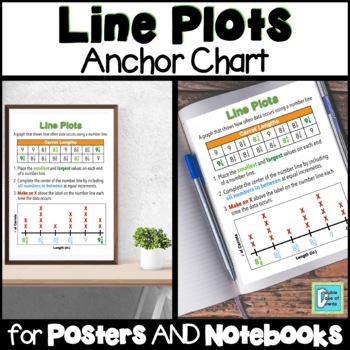
Line Plots Anchor Chart Interactive Notebooks & Posters
This anchor chart for line plots shows students a visual example as well as the definition and instructions on how to use data from a table to create a line plot. We prefer to keep anchor charts simple and neat so as not to overwhelm our students and to keep them focused on essential information. This is a one-page anchor chart that comes in a variety of formats including a single sheet, half sheets (great for interactive notebooks), and a 2x2 POSTER. The poster will print on 4 sheets of paper
Subjects:
Grades:
4th - 6th
CCSS:

Bar Graphs, Line Plots, Pictographs Teaching Posters and Worksheets
This Graphing Math Unit contains:
* 3 Bar Graph Teaching Posters
* 3 Line Plot Teaching Posters
* 3 Pictograph Teaching Posters
* 2 Bar Graph Teaching Worksheets
* 2 Line Plot Teaching Worksheets
* 2 Pictograph Teaching Worksheets
Answer Keys Included
Subjects:
Grades:
2nd - 4th
Types:
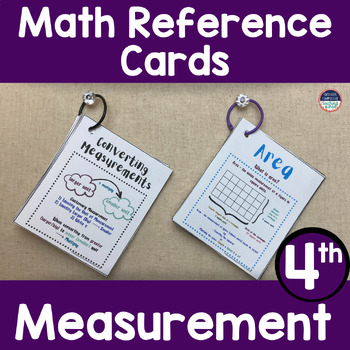
4th Grade Math Reference Cards Measurement Concepts in Action
Introducing the comprehensive set of 4th-grade reference cards, designed to bring measurement concepts to life for young learners! These interactive and engaging cards are designed to help students explore and master the fascinating world of measurement with ease and enthusiasm.This Product Includes:✅ 4th Grade Measurement Standards✅ 21 Reference Cards✅ 2 Cover Designs✅ 19 Concept In Action Cards✅ Designed for Binder Rings (pictures with 1-inch Binder Rings)**Key Features:**1. **Visual Learning:
Subjects:
Grades:
4th
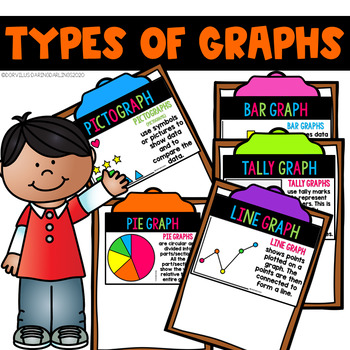
Graph Posters
Hi there!Looking for graph posters for the classroom, look no further!This packet has 5 graph posters in both color and black and white versions included.Posters Included:Bar graph (2 versions)Line graphPictographPie graphTally chart*If you have any questions feel free to email me before purchasing the product: dorviljinnie@gmail.comPlease leave feedback, I always reply.
Subjects:
Grades:
2nd - 4th
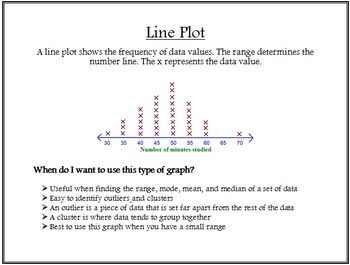
Types of Graphs Posters
Students will explore a variety of different types of graphs and learn about the characteristics and advantageous traits of each type. These posters include the following types of graphs: bar graph, line graph, pictograph, circle graph, line plot, histogram, stem-and-leaf plot, and double line graph. You can display these posters in your classroom for student reference. You can also download my free product named "Types of Graphs Graphic Organizer" and use the posters to help students explore th
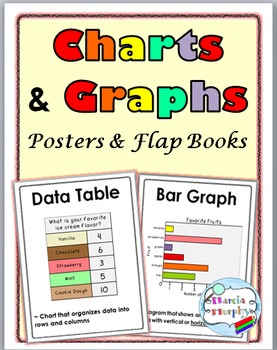
Charts and Graphs Posters and Interactive Flap Books
This file contains 18 color (and 18 black & white) Posters for 10 different mathematical terms plus Interactive Flap Books.This set aligns with Common Core Standards for Measurement and DataEach poster is 8 ½” x 11” but you can set your printer to print smaller sizes if you prefer.The posters included in the set are:• Data Table (2 versions)• Tally Chart (2 versions)• Frequency Table (2 versions)• Pictograph (2 versions)• Bar Graph – Vertical• Bar Graph – Horizontal• Line Plot (2 versions)•
Subjects:
Grades:
2nd - 4th
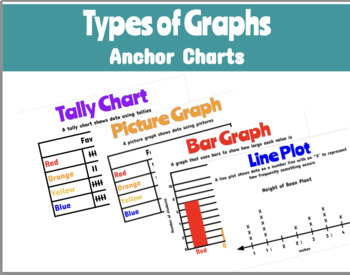
Types of Graphs: Anchor Charts
Looking for a way to help students understand different types of graphs? This is the product for you!Included you will find digital anchor charts for tally charts, picture graphs, bar graphs, and line plots.Thank you!
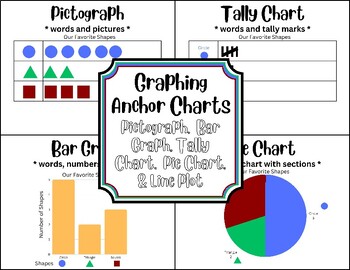
Graphing Anchor Charts
These anchor charts will remind and show students what a pictograph, tally chart, bar graph, pie chart & a line plot look like. All charts have titles and labels on graphs. The charts are printed horizontally.
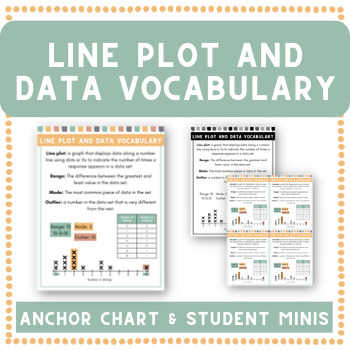
Line Plots and Data | Anchor Chart
This resource will help your students with 4th grade line plot and data vocabulary!What's included:Color anchor chartBlack and White anchor chartColor student minisB&W student minis
Grades:
3rd - 5th
Types:
CCSS:
Also included in: 4th Grade Math ANCHOR CHARTS BUNDLE
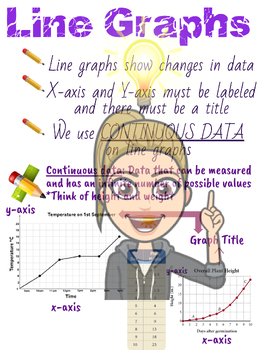
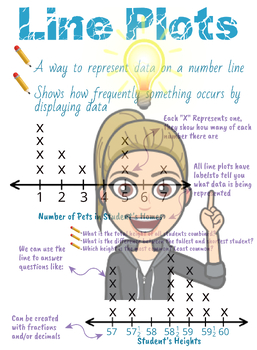
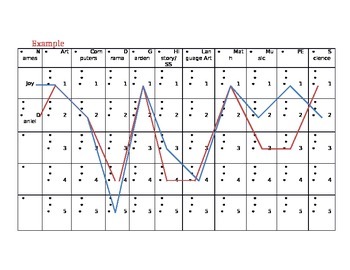
Subject Preferences Graph
This is a beginning of the year activity.
Getting to know your students and gaining insight to the overall trends of your year ahead.
This is a two-part task; first your students will find the trends in their table groups (small groups of 4 – 5 students). Second, you will graph the student data on a long poster or pin board. After each of the two tasks, students share three+ truths about the graphs.
Grades:
4th - 6th
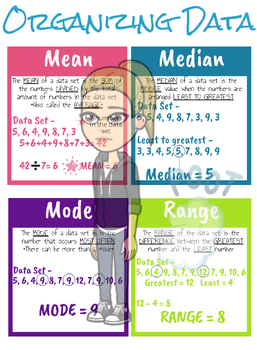
Organizing Data Anchor Chart
Anchor chart for organizing data - finding the Mean, Median, Mode, and Range
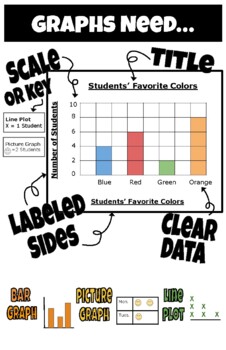
Graphing Anchor Chart
This anchor chart will help your students remember the important elements of a graph and they practice making their own. Keep this is your room printed on 11x17 paper, or print it for students to use as a page of notes. I keep these posters p year round for continuous reminders of current and past units.
Grades:
1st - 6th
Also included in: 3rd Grade Math Anchor Charts
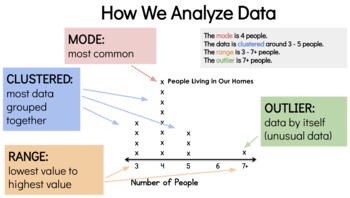
How We Analyze Data Anchor Poster
Here's an easy and clear way to teach vocabulary terms (mode, clustered, range, outlier) used to analyze data in graphs. I reference this anchor poster during my whole graphing unit and the kids respond very well to it! Before you know it, you'll have them regularly using these terms to talk about data!
Subjects:
Grades:
2nd - 5th
Types:
CCSS:
Showing 1-20 of 20 results


