78 results
9th grade statistics interactive whiteboards
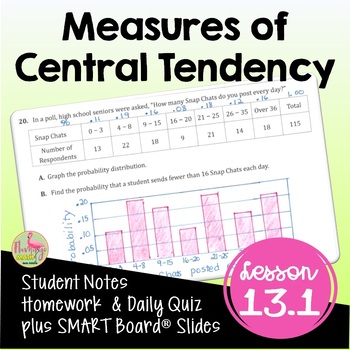
Measures of Central Tendency (Algebra 2 - Unit 13)
Measures of Central Tendency Algebra 2 Lesson:Your Pre-AP Algebra 2 Honors students will draw, analyze and interpret box-and-whisker plots, find outliers, and calculate measures of central tendency in this unit 13 lesson on Data Analysis & Statistics that cover the concepts in depth. #distancelearningtptWhat is included in this resource?⭐ Guided Student Notes⭐ Google Slides®⭐ Fully-editable SMART Board® Slides⭐ Homework/Practice assignment⭐ Lesson Warm-Up (or exit ticket)⭐Daily Content Quiz
Subjects:
Grades:
8th - 11th, Higher Education
CCSS:
Also included in: Algebra 2 Curriculum Mega Bundle | Flamingo Math
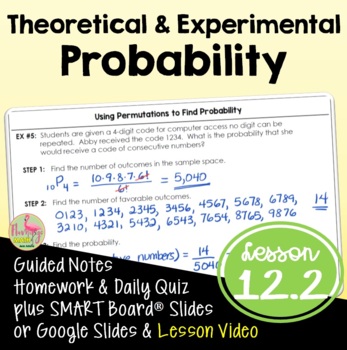
Theoretical and Experimental Probability (Algebra 2 - Unit 12)
Theoretical & Experimental Probability Algebra 2 Lesson:Your Pre-AP Algebra 2 Honors students will find both experimental and theoretical probabilities in this Unit 12 lesson. #distancelearningtptWhat is included in this resource?⭐ Guided Student Notes⭐ Google Slides®⭐ Fully-editable SMART Board® Slides⭐ Homework/Practice assignment⭐ Lesson Warm-Up (or exit ticket)⭐ Daily Content Quiz (homework check)⭐ Video Lesson Link for Distance Learning - Flipped Classroom models⭐ Full solution setStude
Subjects:
Grades:
8th - 11th, Higher Education
CCSS:
Also included in: Algebra 2 Curriculum Mega Bundle | Flamingo Math
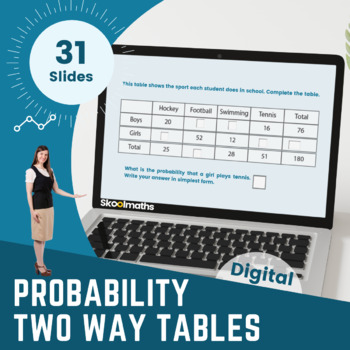
Conditional Probability | Two Way Tables | Digital Lesson CCSS.HSS-CP.A.1
Conditional Probability - Two Way Table is a completely interactive lesson designed for High School learners. Buy this great value bundle of interactive probability activities today to save you hours of planning and don't forget to leave an honest review if you download this digital probability resource for TPT credit :)This lesson will teach your maths class how to calculate the probability for two events. What they will learn:How to read the information given in a two-way table and answer rel
Subjects:
Grades:
7th - 10th
CCSS:
Also included in: Complete Statistics and Probability Bundle | Digital and Print
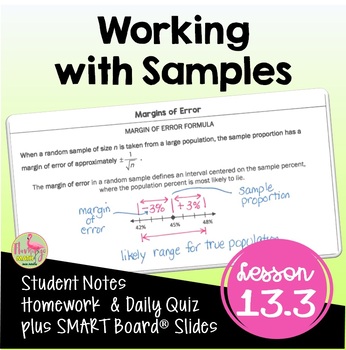
Working with Samples (Algebra 2 - Unit 13)
Working with Samples Algebra 2 Lesson:Your Pre-AP Algebra 2 Honors students will find draw, analyze and interpret box-and-whisker plots, find outliers, and calculate measures of central tendency in this unit 13 lesson on Data Analysis & Statistics that cover the concepts in depth. #distancelearningtptWhat is included in this resource?⭐ Guided Student Notes⭐ Google Slides®⭐ Fully-editable SMART Board® Slides⭐ Homework/Practice assignment⭐ Lesson Warm-Up (or exit ticket)⭐Daily Content Quiz (ho
Subjects:
Grades:
8th - 11th, Higher Education
CCSS:
Also included in: Algebra 2 Curriculum Mega Bundle | Flamingo Math
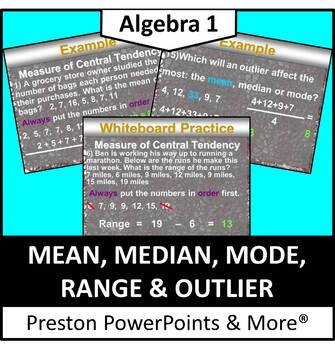
Mean, Median, Mode, Range and Outlier in a PowerPoint Presentation
Mean, Median, Mode, Range and Outlier in a PowerPoint PresentationThis slideshow lesson is very animated with a flow-through technique. It was made for my Algebra 1 class, but can be used for lower grades aw well. The lesson teaches how to solve for mean, median, mode and range. It also teaches to identify outliers in a set of data and find the measure of central tendency.NEW: The lesson is in an editable format so you can tailor the lesson to your class. The problems and clipart can’t be edit
Subjects:
Grades:
6th - 10th
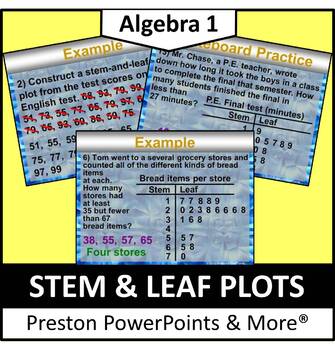
Stem and Leaf Plots in a PowerPoint Presentation
Stem and Leaf Plots in a PowerPoint PresentationThis slideshow lesson is very animated with a flow-through technique. I developed it for my Algebra 1 class, but it can be used for lower grades as well. This lesson was one of a chapter that was used as a review for all previous grades. The lesson teaches how to interpret data from the stem-and-leaf plot and make and use a stem-and-leaf plot to put data in order.NEW: The lesson is in an editable format so you can tailor the lesson to your class.
Subjects:
Grades:
6th - 9th
CCSS:
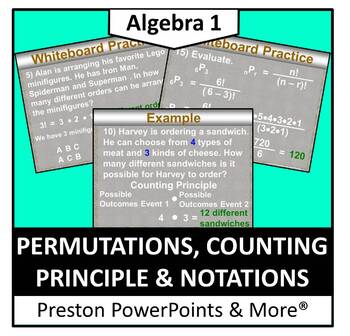
Permutations, Counting Principle and Notations in a PowerPoint
Permutations, Counting Principle and Notations in a PowerPoint PresentationThis slideshow lesson is very animated with a flow-through technique. I developed the lesson for my Algebra 1 class, but it can also be used for upper level class reviews. This lesson teaches how to find the total number of permutations, solve a combination problem, solve permutations and combination problem in notation form.NEW: The lesson is in an editable format so you can tailor the lesson to your class. The problem
Subjects:
Grades:
8th - 11th
CCSS:

Statistics animated powerpoint lesson template
Content:1.Introduction2.Discrete Data3.Continuous Data4.Central Tendancy of a Data Set5.Range and Interquartile Range6.Box and Whisker Plot
Subjects:
Grades:
8th - 9th
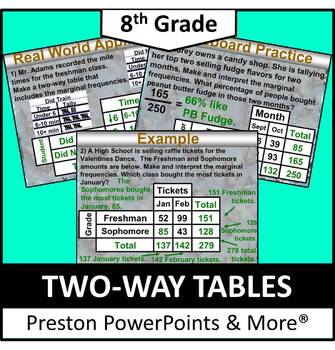
(8th) Two-Way Tables in a PowerPoint Presentation
8th Grade Math (Pre-Algebra) Two-Way Tables in a PowerPoint PresentationThis slideshow lesson is very animated with a flow-through technique. I developed the lesson for my 8th grade class, but it can also be used for upper level class reviews. This lesson teaches how to read two-way tables, make and interpret two-way tables, and use graphs to organize and solve real-life data problems, such as the most liked movie genre.This lesson has SKELETON NOTES, notes that have the problem only. I used t
Subjects:
Grades:
7th - 9th
CCSS:
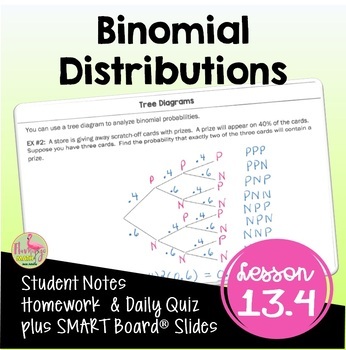
Binomial Distributions (Algebra 2 - Unit 13)
Binomial Distributions Algebra 2 Lesson:Your Pre-AP Algebra 2 Honors students will calculate measures of central tendency, draw, analyze, and interpret box-and-whisker plots and find outliers using binomial distributions in this Unit 13 lesson. #distancelearningtptWhat is included in this resource?⭐ Guided Student Notes⭐ Google Slides®⭐ Fully-editable SMART Board® Slides⭐ Homework/Practice assignment⭐ Lesson Warm-Up (or exit ticket)⭐ Daily Content Quiz (homework check)⭐ Video Lesson Link for Dis
Subjects:
Grades:
8th - 11th, Higher Education
CCSS:
Also included in: Algebra 2 Curriculum Mega Bundle | Flamingo Math

Statistics animated powerpoint template lesson part 1
Statistics animated lesson:content:1.Introduction2.Discrete Data3.Continuous Data4.Central Tendancy of a Data Set
Subjects:
Grades:
8th - 9th
Also included in: Statistics animated powerpoint lesson template
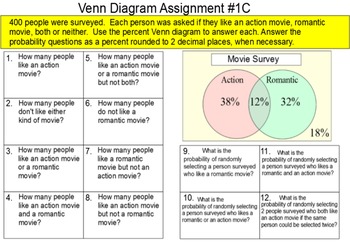
Venn Diagrams with Probability, 2 Lessons + 16 Assignments for SMART
Included in this zip folder are 19 SMART Notebook files. 2 are for instruction, 1 is a student reference handout and 13 are assignments. A brief description of each:
Instruction file #1 is a 36 slide introduction to reading a Venn diagram. Some formative assessment problems are included.
Instruction file #2 is a 25 slide introduction to the complement of a set in a Venn diagram.
Assignment A is a matching assignment. The student matches 10 2 circle Venn diagrams with union, intersection and
Subjects:
Grades:
8th - 11th
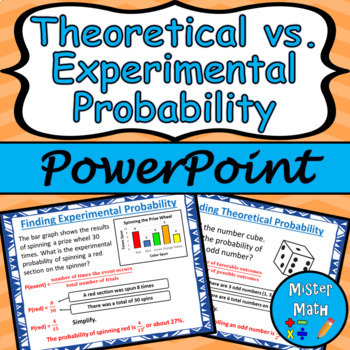
Theoretical vs. Experimental Probability PowerPoint Lesson
This is a PowerPoint Presentation to assist students in learning about theoretical and experimental probability. Students will learn the concepts of theoretical and experimental probability, as well as how to find the probabilities of each. Overall, the 21-slide PowerPoint Lesson covers the following topics:Theoretical ProbabilityUsing Theoretical ProbabilityExperimental ProbabilityMaking PredictionsComparing Theoretical & Experimental Probability Plenty of real-life examples are included to
Subjects:
Grades:
6th - 9th
Also included in: Theoretical vs. Experimental Probability PPT & Guided Notes BUNDLE

Statistics animated powerpoint lesson template part 2
Statistics part 2:1.Range and Interquartile Range2.Box and Whisker Plot
Subjects:
Grades:
8th - 9th
Also included in: Statistics animated powerpoint lesson template
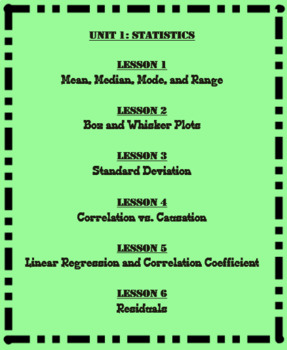
Unit 1-Statistics (Math 1)
This is the first Unit of the eight Units that I cover in Math 1. This unit is broken up in to six different lessons that are listed below. Each lesson includes a SMART Notebook presentation, a student note-taking guide, and an answer key. Also included in this unit are student flashcards, a test outline, and a 25 question multiple choice test.
Unit 1: Statistics
Lesson 1: Mean Median Mode Range Outliers and Skew
Lesson 2: Box and Whisker Plots
Lesson 3: Standard Deviation
Lesson 4: Correlati
Subjects:
Grades:
6th - 12th
CCSS:
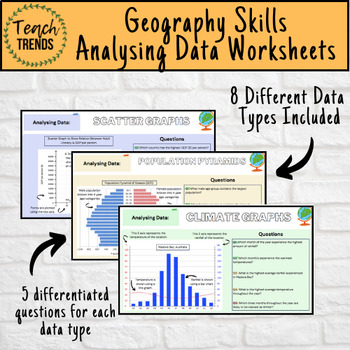
Geography Data Analysis Skills Work Booklet / Activities
Enhance your pupils’ geographical skills with a series of interpretation and analysis sheets and questions. This resource includes 8 PDF slides with corresponding questions all focused on a different data presentation method. Ideal for preparing your pupils for exams and revising analysis skills. The high quality slides include annotations, examples and five scaled-ability questions.The data presentation skills included in this resource are:Climate GraphsPopulation PyramidsChoropleth MapsScatter
Subjects:
Grades:
8th - 12th, Adult Education
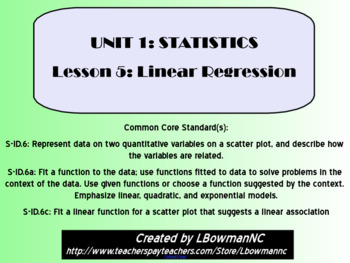
Linear Regression and the Correlation Coefficient (Math 1)
This lesson is the fifth of six lessons in the Math 1 Statistics Unit.
This lesson includes important vocabulary, examples (guided practice), and class work (independent practice). At the end of the presentation is a Ticket Out the Door that can be used as a formative assessment.
There is a note-taking guide for the students to fill out as the teacher goes through a SMART Notebook presentation.
Unit 1: Statistics
Lesson 1: Mean Median Mode Range Outliers and Skew
Lesson 2: Box and Whisker
Subjects:
Grades:
6th - 12th
CCSS:
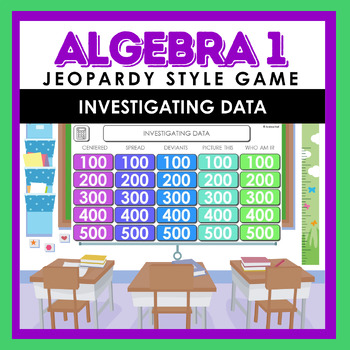
Algebra I: Investigating Data Jeopardy Style Review Game
You’ll love your new Jeopardy Style Vocabulary Review Game for Investigating Data. It is perfect for Distance Learning, Whole Class Review, Small Group Work, Independent Practice, and Test Preparation. This awesome product reviews key vocabulary terms covered in : Investigating Data such as: association, box plot, causation, center, correlation coefficient, First Quartile (Q1), five-number summary, histogram, interquartile range, line of best fit, Mean Absolute Deviation (MAD), outlier, quantita
Subjects:
Grades:
8th - 10th
Also included in: Algebra I Jeopardy Style Review Games Bundle
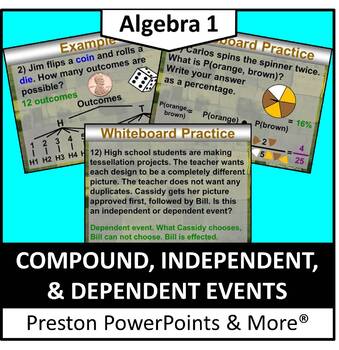
Compound, Independent, & Dependent Events in a PowerPoint Presentation
Compound, Independent, & Dependent Events in a PowerPoint PresentationThis slideshow lesson is very animated with a flow-through technique. I developed the lesson for my Algebra 1 class, but it can also be used for upper level class reviews. This lesson teaches how to find the total number of outcomes from a compound event, identify if an event is independent or dependent, & find the probability of an compound event. NEW: The lesson is in an editable format so you can tailor the lesson
Subjects:
Grades:
7th - 11th
CCSS:
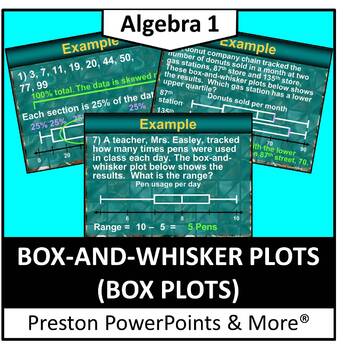
(Alg 1) Box and Whisker Plots in a PowerPoint Presentation
Algebra 1 Box and Whisker Plots in a PowerPoint PresentationThis slideshow lesson is very animated with a flow-through technique. I developed the lesson for my Algebra 1 class, but it can also be used for upper level class reviews. This lesson teaches how to make and interpret box-and-whisker plot to organize real-life data, find interquartile ranges of data sets, and compare box-and-whisker plots.This lesson has SKELETON NOTES, notes that have the problem only. I used this with our 1-1 distri
Subjects:
Grades:
6th - 10th
CCSS:
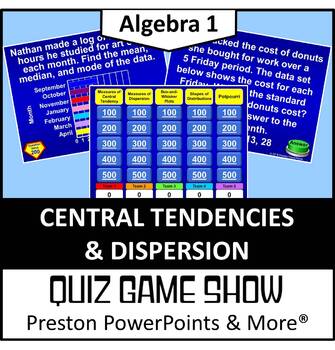
(Alg 1) Quiz Show Game Central Tendencies and Dispersion in a PowerPoint
Algebra 1 Quiz Show Game Central Tendencies and Dispersion in a PowerPoint PresentationThis Quiz Show game, Jeopardy Style, is a great way to review a chapter. There are 25 questions and a scoreboard so you don’t have to write it on a side board. Each page has the point value!This Quiz Show game covers all of the following:Measures of Central Tendency S.ID.2, S.ID.3Measures of Dispersion (Standard Deviation) S.ID.2, S.ID.3Box-and-Whisker Plots S.ID.1, S.ID.2, S.ID.3Shapes of Distributions S.ID
Subjects:
Grades:
6th - 10th
CCSS:
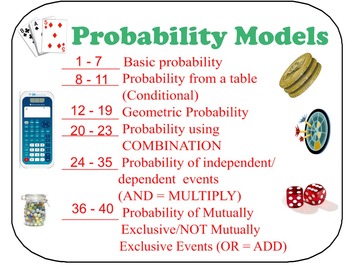
BUNDLE *** FCP, Perm, Comb, & Probability Models Lessons & Exit Ticket
BUNDLE of:
Exit Ticket on FCP, Permutation, & Combination
FCP, Permutation, and Combination - PDF 36 problems
FCP, Permutation, and Combination - Smart Notebook 36 problems
Probability Models - Power Point illustrated models
Probability Models - PDF 40 questions
Probability Models - Smart Notebook 40 questions
Visual Representation of Standard Deck of Cards
For more details, please check the individual description of those items.
Separately, these would cost more than $12.99
☺Would love
Subjects:
Grades:
6th - 12th, Higher Education, Adult Education
Probability Models
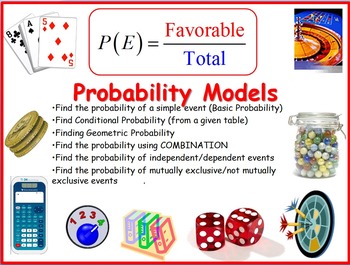
This handout drills the understanding of the different models of probability. Student would have to first determine under which model should this problem fit, then, apply the appropriate strategy to answer the questions. There are many ways to answer each of the questions provided in this handout. I provided "An" answer key.
In this handout, you will find a set of 40 questions on the following probability models:
1. Detailed visual description of the Standard Deck of Cards
2. Basic Probab
Subjects:
Grades:
6th - 12th, Higher Education, Adult Education, Staff
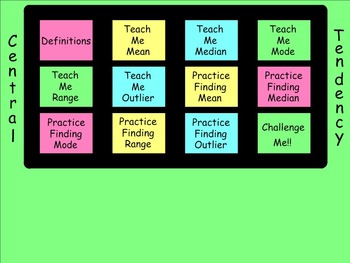
How I Teach Finding Mean, Median, Mode, Range, and Outliers
This is a 70 page Smartboard file covering Central Tendency. The students are given definitions for Mean, Median, Mode, Range, and Outlier. They are also taught how to find each when given a list of numbers. There are plenty of practice pages for each and all include answers. There is also a section of more challenging problems at the end. All pages are linked to a central homepage so that no matter where you are in the file it will always be easy to navigate around.
Subjects:
Grades:
6th - 9th
Types:
Showing 1-24 of 78 results


