121 results
9th grade statistics resources for Easel Activities
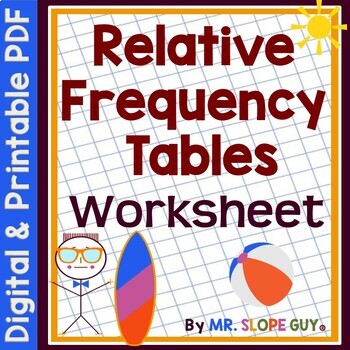
Two Way Relative Frequency Tables Worksheet
Are you a math teacher looking for engaging classwork or homework activities to help your students with relative frequency tables? Look no further! Our worksheet on completing two-way tables and creating relative frequency tables is perfect for your needs. Great for Pre-Algebra and Algebra 1 students. With real-world situations and comprehension questions based on relative frequency tables, students will learn to summarize and interpret data collected from the same subjects. They'll construct an
Subjects:
Grades:
8th - 9th
Types:
CCSS:
Also included in: Scatterplots Two Way Tables and Residual Plots Worksheets Bundle
Estimating Correlation Coefficient with Scatter Plots Worksheet
Attention Math Teachers! Are you looking for a way to help your students master estimating correlation? Look no further! Our engaging worksheet is designed to match scatter plots with the correct correlation coefficient. With a variety of reasonable choices, students will estimate the correct r value and interpret positive and negative slope, as well as the strength or weakness of the correlation coefficient of a linear fit.This two-sided worksheet comes with an easy-to-use key and is perfect fo
Subjects:
Grades:
9th
Types:
CCSS:
Also included in: Data and Statistics Worksheets Bundle
Correlation vs Causation Worksheet
Hello Math Teachers! Help your math students understand the difference between correlation and causation with our fun activity worksheet. Students will evaluate 42 statements and determine whether they demonstrate correlation or causation, and there are some multiple-choice questions as well. This activity also includes a puzzle that generates an answer, making it easy to grade.This two-sided worksheet is great for classwork or homework and is designed to help students develop critical thinking
Subjects:
Grades:
9th
Types:
CCSS:
Also included in: Algebra Math Riddle Worksheets
Two Way Tables Worksheet
Attention Math Teachers! Download this two-sided worksheet on completing two-way tables and analyzing bivariate data today! This worksheet is perfect for Pre-Algebra and Algebra 1 students as a classwork or homework activity.By completing this worksheet, students will check their understanding of how patterns in bivariate data can be seen by displaying frequencies and relative frequencies in a two-way table. They will also learn how to construct and interpret two-way tables, summarizing and inte
Subjects:
Grades:
8th - 9th
Types:
CCSS:
Also included in: Scatterplots Two Way Tables and Residual Plots Worksheets Bundle
Permutations and Combinations Task Cards plus QR
This set of Combinations, Permutations, and Counting Task Cards with applications will really have your students thinking.This activity reinforces the concepts of permutations, combinations, and counting principles. The concepts are not separated on the cards, nor coded, so students must first decide what type of question it is before solving. The cards can also be used for a sorting activity. The difficulty levels are mixed on the cards. Included: Two sets of 24 cards, one with QR codes and
Subjects:
Grades:
7th - 10th
Types:
CCSS:
Also included in: Algebra 1 Activity Bundle
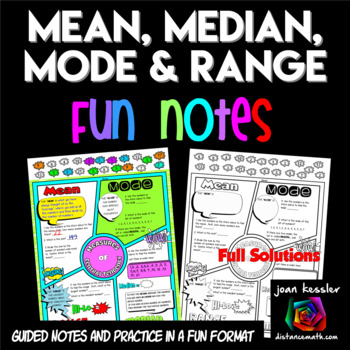
Measures of Central Tendency FUN Notes Doodle Pages
Your students will love learning the Measures of Central Tendency with these Fun Notes done in a comic book theme. Topics include Mean, Median, Mode, and Range. Students complete 6 problems plus definitions. There are two versions of the notes so you can differentiate. The PDF also includes 2 sizes, one standard 81/2 x 11" and the other in half size for INB's. Students love to doodle while learning and it has been shown that doodling and working with fun themed activities help students engage
Subjects:
Grades:
6th - 9th
Also included in: Algebra 1 FUN Notes Doodle Page Bundle
Residuals and Residual Plots Worksheet
Hello Math Teachers! Enhance your students' understanding of residual plots and scatter plots with this exciting activity!This two-sided worksheet focuses on understanding and creating residual plots. Your students will evaluate scatter plots as linear or quadratic, choose which ones should be modeled with linear or quadratic equations, create a scatter plot, write an equation to model data, determine if several residual plots would be a "Good Fit" for data, and calculate and construct a residua
Subjects:
Grades:
9th
Types:
CCSS:
Also included in: Scatterplots Two Way Tables and Residual Plots Worksheets Bundle

Hypothesis Tests Introduction Statistics
My Statistics students always had trouble setting up the Null Hypothesis and the Alternative Hypothesis, and without understanding this, the tests and interpretations cannot be determined properly. Now I explain the unit and what Hypothesis Testing is all about first, and start them off with this set of notes and problems. At first they are excited not to do any math or calculations, but then the challenge begins.There are two sets of the problems, one multiple choice and the other mostly free
Subjects:
Grades:
9th - 12th
CCSS:
Independent & Dependent Probability Color by Number (Distance Learning)
Students of all ages love to color! Make practicing more fun with this color by number activity.Note: Using a digital color by number activity works best with iPads where coloring can be done using an app such as Notability.Students will calculate the probability of independent and dependent events. Twelve word problems are included. The focus is on learning about compound events. Specifically, students will examine the difference between independent events (with replacement) and dependent e
Subjects:
Grades:
6th - 9th
Types:
Also included in: Color by Number Bundle
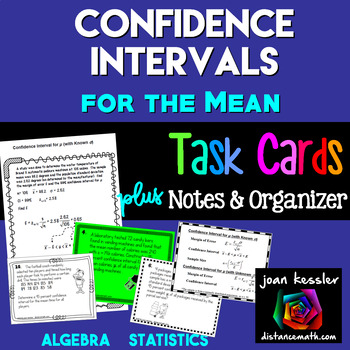
Confidence Intervals for the Mean
Your students will grasp Confidence Intervals for the Mean with this resource which includes Guided Notes, Task Cards, and a Graphic Organizer.What's Included?18 Task Cards for students to practice constructing confidence interval for the mean using the z - distribution and the t - distribution.Cards # 1 - 8 find Confidence intervals given statisticCards # 9 - 10 find Confidence intervals given dataCards # 11 - 12 find sample sizeCards # 13 - 15 find the margin of errorCards # 16 - 18 Given
Subjects:
Grades:
9th - 12th
CCSS:

A Beautiful Mind (2001): Complete Movie Guide & Introduction to Game Theory
A Beautiful Mind is a 2001 American biographical drama film based on the life of John Nash, a Nobel Laureate in Economics. The film was directed by Ron Howard, from a screenplay written by Akiva Goldsman.These teacher-generated questions (27 in total) are designed to help students focus in on key information during the video. This movie guide also comes with an example of Game Theory (Prisoner's Dilemma) and a short reading on the history of the Nobel Prize. This guide will help your students ge
Subjects:
Grades:
9th - 12th
Types:
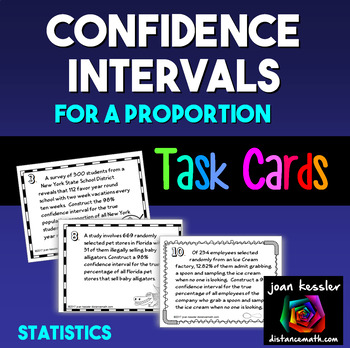
Confidence Intervals for a Proportion Applications
This Confidence Intervals for a Proportion Real World Applications resource will engage your students and give them fluency with confidence intervals.What's included? 12 Task Cards designed to reinforce the concepts taught in class. The illustrated cards include 90, 95, 98, and 99% confidence intervals for real life (some humorous) applications. Student response sheets which include room for students to show work. They are unnumbered so you can choose all or some of the problems. Answer keys
Subjects:
Grades:
9th - 12th
Types:
CCSS:
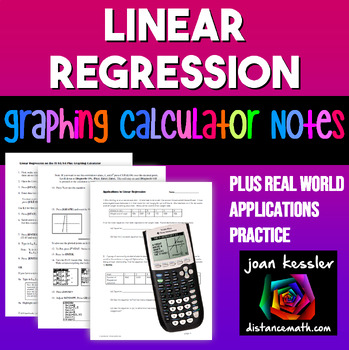
Linear Regression | TI-84 Graphing Calculator plus Applications
This clear, concise, step by step notes help your students use the TI 83 and TI 84 Graphing Calculator to enter data into lists, create a linear regression equation and to plot the equation along with the data simultaneously. Also included is a 3 page worksheet with five real world examples for students to practice. Solutions included. These can be used as Binder Notes or printed smaller for Interactive Notebooks._________________________________________________Related Products★ Quadratic Re
Subjects:
Grades:
9th - 11th, Higher Education
Types:
CCSS:
Also included in: Linear Functions and Systems Algebra 2 Unit 2 Activity Bundle
Relative Frequency Two Way Tables by Total Row or Column Worksheet
Attention Math Teachers! Enhance your students' understanding of relative frequency tables with our Two-Way Tables Worksheet. This two-sided worksheet is designed to help students create accurate relative frequency tables from basic information given in the form of a two-way table.The worksheet focuses on completing tables when using the totals by either the row or the column equal to 1.00. By practicing this skill, students will strengthen their ability to analyze data and draw conclusions.With
Subjects:
Grades:
8th - 9th
Types:
CCSS:
Also included in: Scatterplots Two Way Tables and Residual Plots Worksheets Bundle
Histograms Interpreting and Creating Worksheet
Hey Math Teachers! This Histograms Worksheet is the perfect resource to help your students master constructing and interpreting histograms. This two-sided Math worksheet includes progressively challenging problems on displaying numerical data using histograms and questions on interpreting histograms. We provide scaffolding to help your students identify the components of a set of data, assess the skew of data, and report the number of observations.This worksheet is suitable for Middle School Mat
Subjects:
Grades:
6th - 9th
Types:
CCSS:
Also included in: Data and Statistics Worksheets Bundle
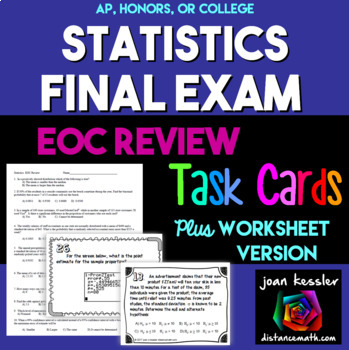
Statistics Final Review Task Cards plus Practice Test
This Statistics Final - Review - Task Card Resource is a great Final Exam Practice or Review for AP Statistics; Honors Statistics, or College Statistics.Sometimes a worksheet isn’t enough to gets students motivated, especially for an end of course review. Activity Based Learning with Task Cards really does work to help reinforce students' skills. Task and Station Cards get your students engaged and keep them motivated. Use all at once or as many as you like. Ideas for using Task Cards included i
Subjects:
Grades:
9th - 12th
Types:
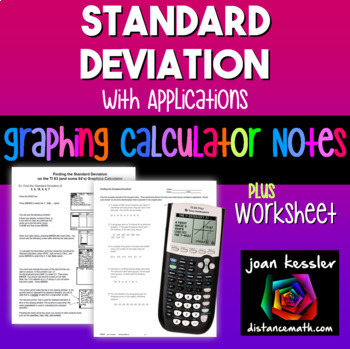
Standard Deviation on TI-84 Reference Sheets plus Practice
With this Determining the Standard Deviation on the TI 83 TI 84 Graphing Calculator plus HW step by step reference sheet your students will learn to use the graphing calculator effectively in finding the standard deviation from a data set. Use as Binder Notes or printed smaller for Interactive Notebooks.What's included?Two reference/handouts for students to learn how to find the Standard Deviation for both a population and for sample. One is for the TI 83 (yes, still in use) and the other for th
Subjects:
Grades:
8th - 11th
CCSS:
Finding Mean, Median, Mode, and Range
Simple worksheets (5 problems each) to introduce and practice finding the mean, median, mode, and range of a data set. Have students complete with or without calculator, depending on their instructional level. Product includes:-Reference posters for mean, median, mode, and range. Each poster includes the measures' definitions and directions for how to find them with an example.-5 worksheets about finding the mean.-5 worksheets about finding the median.-5 worksheets about finding the mode.-5 work
Subjects:
Grades:
1st - 12th
Types:
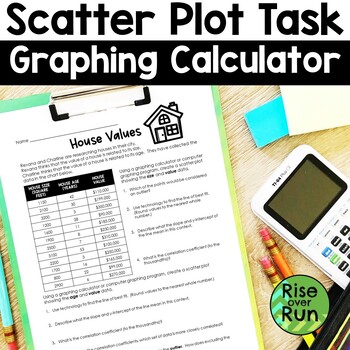
Scatter Plot Worksheet with Graphing Calculator Practice
Need a real world scatter plot activity where students use their graphing calculators? Grab this activity and help your students understand lines of best fit and calculating correlation coefficients!Students are given data on house sizes, house ages, and house values. They use a graphing calculator or computer program to plot the points and answer questions that follow.This is a great activity for partners to explore or for individual work. It can lead to some great math discussions!Answer key
Subjects:
Grades:
8th - 9th
Types:
CCSS:
Also included in: Algebra 1 and 8th Grade Math Curriculum Bundle for Entire Year
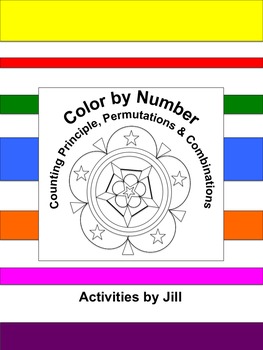
Counting Principle - Permutation - Combination Color by Number
Need a different sort of assignment for a change of pace? Middle and high school students enjoy color by number worksheets. Maybe this is because they don't get to color much after elementary school? If you've never used this type of assignment before, give it a try!Note: Using a digital color by number activity works best with iPads where coloring can be done using an app such as Notability.This activity consists of 11 word problems to be solved using the counting principle, permutation form
Subjects:
Grades:
7th - 11th
Types:
Also included in: Color by Number Bundle
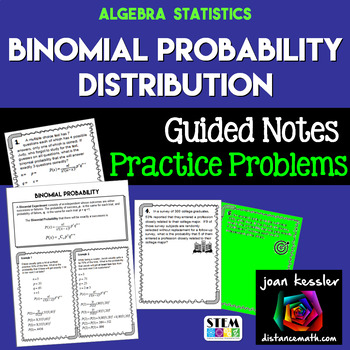
Binomial Probability Distribution Notes Practice Statistics
This Binomial Probability Distribution Guided Notes, Task Cards, and Practice Problem resource contains 4 smaller activities which will help your students determine Binomial Probabilities using the Binomial Probability Formula. The first part consists of Guided Notes with two completed examples. These examples are applications. The second activity can be used as Worksheets, Task Cards, or Stations and has eight applications to Binomial Probabilities. Full solutions included.Because teachers m
Subjects:
Grades:
9th - 12th
CCSS:
Also included in: Probability and Statistics Algebra 2 Unit 11 Activity Bundle
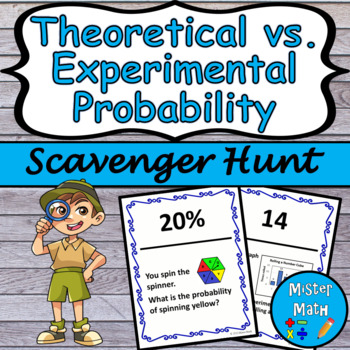
Theoretical vs. Experimental Probability Scavenger Hunt
Looking for a way to get your students out of their seats and engaged in the content? This scavenger hunt is just what you've been looking for to help students strengthen their skills with theoretical and experimental probability! Perfect for extra practice or a review before an assessment! The questions included are meant to be posted around the room. Students will then start at a question, working either independently, with a partner, or with a group. Once the question has been answered, stude
Subjects:
Grades:
6th - 9th
Types:
Also included in: Probability MEGA BUNDLE
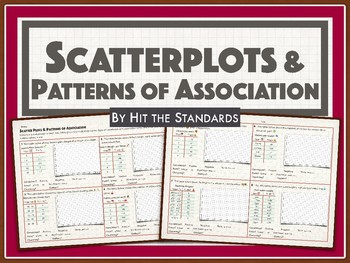
Scatterplots & Patterns of Association
Students must construct and interpret scatter plots from 8 different data tables and investigate patterns of association such as clustering, outliers, positive or negative correlation, linear or nonlinear association. Data tables are based on real world problems, students must plot the data points to construct the scatter plots. Common Core 8SP.1 & 8SP.2TEKS 8.11A Save $$$ and time by downloading the complete 8th Grade Math Unit10 Making Connections (End of Year Activities) (STAAR review) 4
Subjects:
Grades:
6th - 9th
Types:
CCSS:
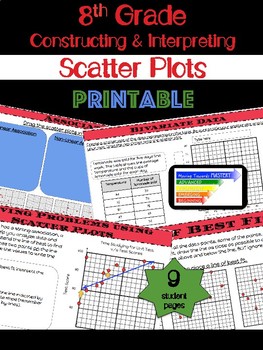
8th Grade Math Constructing & Interpreting Scatter Plots
Extensive printable lessons for constructing and interpreting scatter plots.The lessons are scaffolded to build understanding. Students will progress from identification of terms to making predictions involving bivariate data. The guided lessons will begin with identification, move towards assisted analysis, and conclude with independent practice.Lessons include...♦ Definitions and Visual Representations♦ Identification and Use of Terms → Bivariate Data → Scatter Plot → Linear, Nonli
Subjects:
Grades:
8th - 10th
Types:
CCSS:
Also included in: 8th Grade Math Common Core Growing Bundle
Showing 1-24 of 121 results


