78 results
12th grade statistics resources for Microsoft Excel
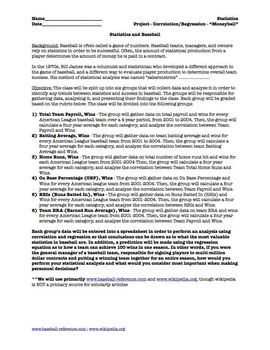
Statistics Correlation and Regression Project for Movie "Moneyball" (5 day)
Prerequisite: Correlation and Regression (Linear). This is a project that divides a statistics class into 6 groups and students do ACTUAL data collection from given websites and they perform their OWN ANALYSIS. They will use computers/internet/excel/spreadsheets/graphing calculators to evaluate correlation. If you have interest in baseball and statistics, this is a great project to get the class interested, and covers about 5 days, plus you can watch the movie "Moneyball" afterwards as a reward.
Subjects:
Grades:
10th - 12th, Higher Education, Adult Education
Types:
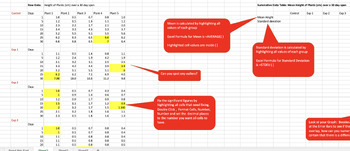
Bundle - Help with Science Fair Table, Graphs, Statistics using Excel.
This comprehensive 3-part bundle comprises a video tutorial, an informative handout, and an Excel file meticulously guiding students through a step-by-step process. The aim is to empower students with the skills to transform raw data into concise summative data tables and graphs, complete with standard deviation error bars. The tutorial covers the entire spectrum – from utilizing Excel for table and graph preparation to conducting statistical analyses using Anova tests, t-tests, or correlation m
Subjects:
Grades:
9th - 12th
Types:
Statistics Unit 9 Bundle - Hypothesis Testing (one sample) (18 days)
This is a unit plan bundle for a Statistics class. The plans include common core math standards, time frame, activities, enduring understandings, essential questions, and resources used. It is designed to last 18 days, depending on pacing. The plans include: 56-slide presentation, with annotated guide for reference5 Worksheets1 "Read & Respond" Article Worksheet2 Quizzes"Do Now" Entrance problemsSpreadsheet Activity - Hypothesis TestingReview slides (for peer presentations)Unit ReviewUnit Te
Subjects:
Grades:
10th - 12th, Higher Education
Types:
CCSS:
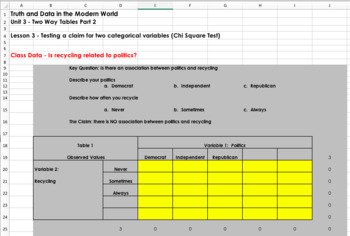
Teaching Statistics with Spreadsheets (Self Grading)
You can see a video that describes the basics of this course at the following link: https://www.youtube.com/watch?v=uZFpltXWyw8This package is an entire statistics course designed for content to be delivered, taught, practiced, and assessed through spreadsheets. Students learn basic statistics and spreadsheet skills. This course is intended to allow for student collaboration and group work throughout the learning process. Each spreadsheet is automatically graded so students can see their progres
Grades:
9th - 12th
Types:
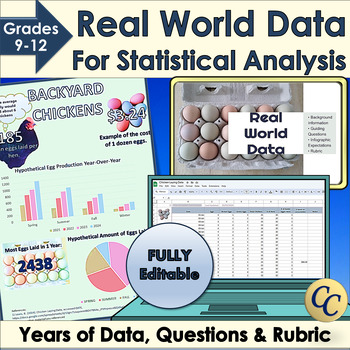
Real World Data for Statistical Analysis and Infographic Project
Give your students access to real world data for your statistical analysis unit or data literacy! Dive into statistics with Microsoft Excel™ or Google Sheets™ and years of data. Learn how to use standard deviation, mean or median to interpret data. Choose the best graphs to display conclusions in an infographic. Works great for science fairs! ✔ Includes an infographic project! (Template, expectations, and rubric). ✔ Everything is fully editable and you and your students can even use the images
Grades:
9th - 12th
Types:
CCSS:
VM Numeracy Unit 2 - Civics - Data and Uncertainty
VCE VM Unit 2 Numeracy book, Civic - Data and Uncertainty. This unit looks at odds, reading and interpreting data, probability and statistics. Includes many hands-on activities.
Subjects:
Grades:
10th - 12th
Types:
Also included in: Bundle 1
Statistics Unit 8 Bundle - Confidence Intervals (19 days)
This is a unit plan bundle for a Statistics class. The plans include common core math standards, time frame, activities, enduring understandings, essential questions, and resources used. It is designed to last 19 days, depending on pacing. The plans include: 52-slide presentation, with annotated guide for reference5 Worksheets3 Quizzes"Do Now" Entrance problemsSpreadsheet Activity - T-DistributionReview slides (for review response system)Unit test (with review packet)Unit Project - Gather Data,
Subjects:
Grades:
10th - 12th, Higher Education
Types:
CCSS:
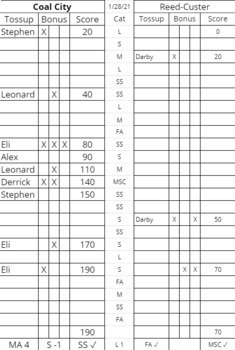
Quiz Bowl/ Scholastic Bowl adaptive stat sheet
DISCLAIMER: Made for IHSA-Compliant Scholastic Bowl. 24 questions per round, 10 point toss-ups, 3 part bonus (each bonus worth 10 points).This is a stat sheet for Scholastic Bowl/ Quiz Bowl practices and games. It adapts in real-time to update the scoreboard and team totals when a name and category abbreviation is applied (see thumbnails for example) The sheet tracks math, science, social studies/history, literature, fine arts, and miscellaneous questions. It is incredibly useful and semi-autono
Subjects:
Grades:
9th - 12th
Printable Graph Paper 10 Squares Per Inch Cross Stitch
Printable Graph Paper 10 Squares Per Inch Cross Stitch - Grid paper is essentially the type of paper most commonly used for drawing and sketching purposes. It is widely used for making plan charts, designing websites, developing home ideas and so forth. A great deal of businesses who need to produce a company card, business brochures, catalogues, brochures, and so forth need this kind of graph paper.
Subjects:
Grades:
5th - 12th
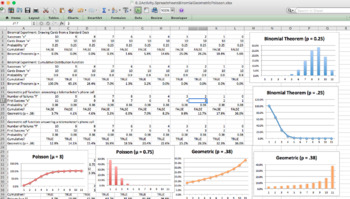
Statistics Spreadsheet Activity - Binomial, Geometric, Poisson (2 days)
Statistics Spreadsheet Activity - Binomial, Geometric, Poisson (2 days) This is a 1-2 day spreadsheet activity for a Statistics class. It uses spreadsheets as a walkthrough to allow students to explore the Binomial, Geometric, and Poisson distributions, as well as create graphs of the distributions. The product includes: 6.3 Spreadsheet Activity (Also included in " Statistics Unit 6 Bundle - Discrete Probability (12 days)" and in " A Mountain of Statistics Curriculum - One Full Year Bundle")Exce
Subjects:
Grades:
9th - 12th, Higher Education
Types:
CCSS:
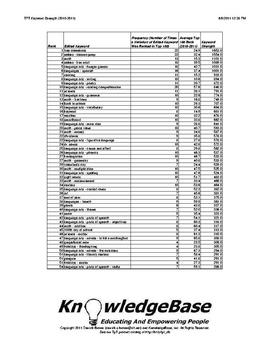
TPT KeyWord Strength Index (2010-2011) - Downloadable Spreadsheet!
What are the strongest keywords on TpT?
1. free downloads
2. Deanna Jump
3. math
Neither #1 nor #2 are surprises, but #3 (math) was certainly a surprise to me!
This report analyzes TpT's 2010-2011 keywords using a measure called "keyword strength".
The measure is based on a keyword's average rank, as well as the number of times it appeared in the 2010-2011 "Top 100" TpT search engine rankings.
This can be a valuable tool to help sellers understand TpT's marketplace supply and demand!
The P
Subjects:
Grades:
PreK - 12th, Higher Education, Adult Education, Staff
AP Statistics 1st Semester Bundle (EXAMVIEW)
Over 1,000 total questions covering all the topics in the 1st semester of AP Statistics. -Graphical Displays-Means and Distributions-Experimental and Sampling Design-Linear Regression-Discrete Distributions-Continuous Distributions-ProbabilityIncluding a separate review bank!Keys includedAll .bnk examview filesTHIS IS AN EXAMVIEW (.BNK) format. This will only open if you have the Examview Assessment Suite Software. It will not open with a word processor. Please do not purchase unless you have t
Subjects:
Grades:
9th - 12th
Types:
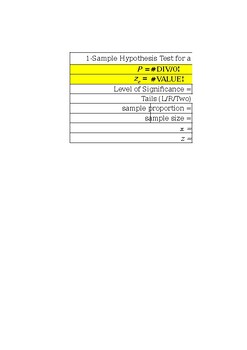
Hypothesis Testing Excel Calculator
Includes 1- and 2- Sample Hypothesis testing for means and proportions
Subjects:
Grades:
11th - 12th, Higher Education
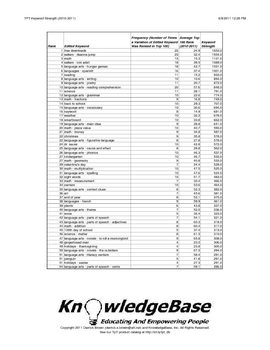
TPT KeyWord Strength Index (2010-2011) - Downloadable PDF!
What are the strongest keywords on TpT?
1. free downloads
2. Deanna Jump
3. math
Neither #1 nor #2 are surprises, but #3 (math) was certainly a surprise to me!
This report analyzes TpT's 2010-2011 keywords using a measure called "keyword strength".
The measure is based on a keyword's average rank, as well as the number of times it appeared in the 2010-2011 "Top 100" TpT search engine rankings.
This can be a valuable tool to help sellers understand TpT's marketplace supply and demand!
The P
Subjects:
Grades:
PreK - 12th, Higher Education, Adult Education, Staff
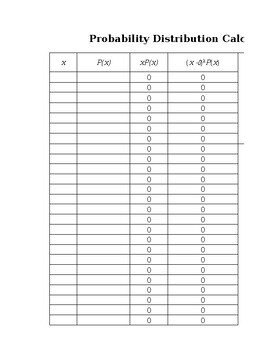
Probability Distribution Excel Calculators
Compute Binomial, Poisson, and Normal Probabilities
Subjects:
Grades:
11th - 12th, Higher Education
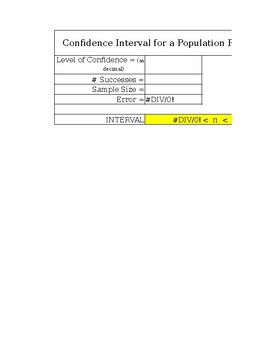
Confidence Interval Excel Calculator
Confidence Intervals for means, proportions, and variances
Subjects:
Grades:
11th - 12th, Higher Education
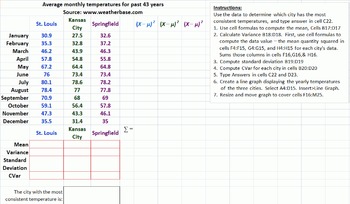
Standard Deviation Activity - Temperatures - Bluman 3-3
This is an Excel activity for students that has them compute the standard deviation and determine which cities have the most consistent temperatures. There is a worksheet for Missouri, New York, and South Carolina. Each worksheet has three major cities and the average monthly temperature. There is also a completed project so that you can compare the formulas used. In the Missouri worksheet, students find standard deviation by using sums, and taking the square root of the variance. In the s
Subjects:
Grades:
10th - 12th
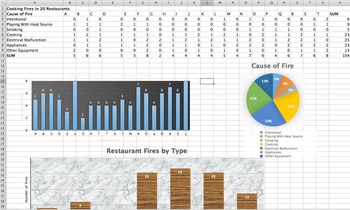
Statistics Project Unit 3 Spreadsheets Mean Median Mode Std. Deviation (2 day)
This is a 1-2 day project aimed at introducing a statistics class to Excel (or Numbers) who are familiar with Pie Charts, Bar Charts, Measures of Central Tendency, and Standard Deviation. The students will input data (included) into Excel (on fires in restaurants), form their own Bar Charts and Pie Charts, and be able to input formulas into the Excel to automatically calculate statistics. Students will be given the opportunity to explore different charts and design their charts to make them colo
Subjects:
Grades:
9th - 12th, Higher Education, Adult Education
Graphs, Charts, and Tables: U.S. Census Data Study
This lesson uses data from the 2010 U.S. Census to allow students to access numbers and data in a social science classroom. The lesson is a 2 day mini-unit centered on working with charts, graphs, and tables (serves extremely well for SAT and ACT prep). This cross-curricular lesson draws meaningful parallels between math and social science, and the necessity of bringing these subjects together. The lesson uses a comparative look at Census data for California and the United States as a whole, but
Subjects:
Grades:
8th - 12th, Higher Education
Types:
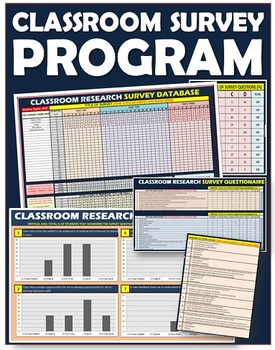
Surveys: Classroom All-IN-ONE Research Program
Empower Your Teaching with Data: Enhance Your Classroom with Powerful Survey Analysis!Elevate your teaching practice by leveraging the power of data with this user-friendly survey analysis program.Here's what sets it apart:Effortless Data Visualization: Transform survey responses into clear and visually appealing charts and graphs.Actionable Insights: Gain valuable insights into student learning styles, preferences, and areas for improvement.Informed Decisions: Make data-driven decisions to enha
Subjects:
Grades:
PreK - 12th, Higher Education, Adult Education, Staff
Types:
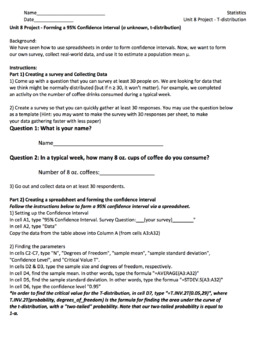
Statistics Unit 8 Project - Surveys, Confidence Intervals, Spreadsheets (3 days)
This is an end-of-unit project with Confidence Intervals for a Statistics class. Students will work together to create a survey, gather real-world data, create a spreadsheet, perform a confidence interval analysis to estimate the population mean μ, and create a Powerpoint presentation to present to class. The Product includes: Instructions for studentsTeacher instructions Excel spreadsheet with samplesGrading Rubric *The topics covered are Confidence Intervals, T-distribution, spreadsheets, pres
Subjects:
Grades:
10th - 12th, Higher Education
Types:
CCSS:
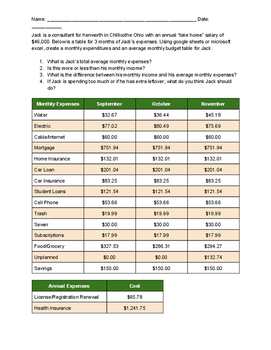
Budget Sheet Assignment
This sheet is a mock example of a person's expenses over the course of three months. It asks students to use technology like excel or google sheets to create tables of expenses. Then compare those tables with an average monthly spending budget sheet. This is mainly to be used to have students practice entering data into the spreadsheet and use the "sum" and "average" equations in the spreadsheet. Afterwards, the students can compare the expenses with the income to see if the budget is over or un
Subjects:
Grades:
9th - 12th
Types:
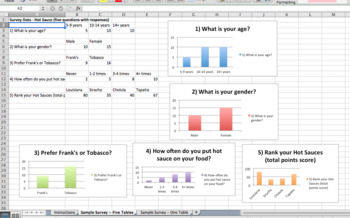
Statistics Unit 1 Project - Gathering Data (3 days)
This is an end-of-unit project for a Statistics class. It is introductory into survey methods, gathering data, using spreadsheets to organize data, creating charts, and presenting findings to the class. The Product includes: Instructions for studentsTeacher instructions for guidance on use and editingExcel spreadsheet with samplesGrading Rubric *The topics covered are survey methods - simple random, stratified, convenience, cluster, systematic - spreadsheets, charts, and presentations. The docum
Subjects:
Grades:
10th - 12th, Higher Education
Types:
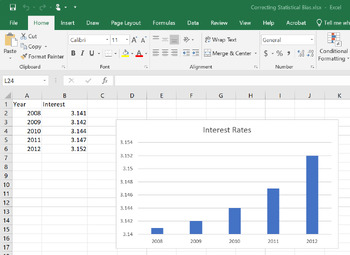
Correcting Statistical Bias with Answer Key
Correcting Statistical Bias is a great tool to use when teaching about statistical bias in the media, news, sports, and politics.It includes 4 graphs that have been manipulated to show bias.You can get your students to practice un-manipulating the graphs using the provided hints to show the real story behind the data and help your students to become more statistically aware.
Subjects:
Grades:
8th - 12th
Showing 1-24 of 78 results


