38 results
11th grade Common Core 7.SP.B.3 resources
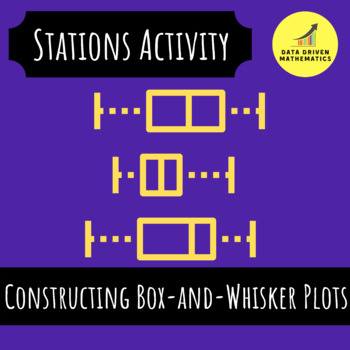
Constructing Box-and-Whisker Plots - Stations Activity
About This Resource:In this activity students will practice constructing box-and-whisker plots when provided a data set. Students will need to calculate the five number summary (minimum, first quartile, median, third quartile, and maximum) in order to be successful on this activity. The prep required by the teacher consists of printing the stations cards, making a copy of the graphic organizer for each student, and setting the expectations and instructions with their students.Your students will
Subjects:
Grades:
6th - 12th
Types:
CCSS:
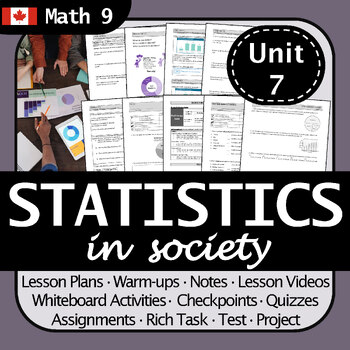
BC Math 9 Statistics in Society Unit: No Prep | Engaging Lessons + Project
Are you searching for a thorough and engaging unit plan for Statistics in Society? Then this resource is for you!This thoughtfully constructed unit is designed to bring math to life, ensuring an enriching learning experience for your students whether you’re in the classroom, at home, or distance learning.With editable files in both .pdf and .docx formats, you have the flexibility to customize the content to suit your students' needs and your teaching style. The preview document contains images a
Subjects:
Grades:
6th - 11th
Types:
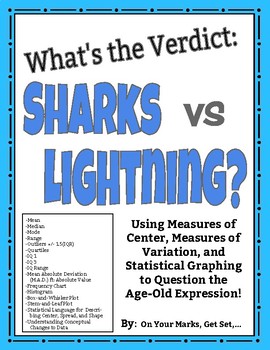
What's the Verdict: Sharks vs. Lightning? Modes of Center, Spread, and More!
Put it to the test! Use the age-old expression: "You are more likely to get struck by lightning than to be bitten by a shark!" to learn and practice Measures of Center, Measures of Spread, Measures of Shape, and Statistical Graphing including:MEANMEDIANMODERANGEOUTLIERS [Using IQR +/- 1.5(IQR)]QUARTILES [lower quartile (IQ-1) and upper quartile (IQ-3)]INTERQUARTILE RANGE (IQR)MEAN ABSOLUTE DEVIATION/ M.A.D. ft. ABSOLUTE VALUESYMMETRY/ASYMMETRY OF DISTRIBUTIONCLUSTERS AND GAPSBELL SHAPED CURVE AN
Subjects:
Grades:
5th - 12th, Higher Education, Adult Education
Types:
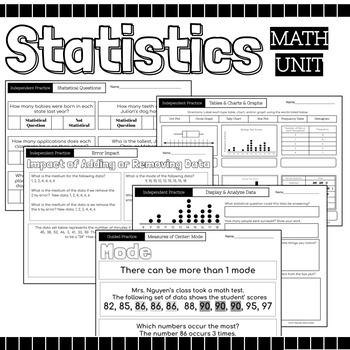
Statistics Math Packet {Data, Charts, Graphs, Mean, Median, Mode, Range, Spread}
52 Page Statics Unit Includes: Guided Instruction & Independent Practice Pages Usage Suggestions and IdeasThis resource can be utilized in numerous ways, here are some ideas:use for guided practiceassign as partner workassign as independent practicecan be used for morning workuse for reteaching in small group settinguse as review prior to assessmentuse as review in continuing to strengthen skillassign for homeworkuse as independent work during math centersTopicsRecognize Statistical Question
Subjects:
Grades:
4th - 12th
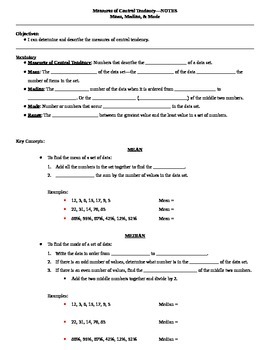
Measures of Central Tendency Guided Notes
These are guided notes for a lesson on measures of central tendency including mean, median, mode, and range. There are several examples in the notes and the same data sets are used to show each measure of central tendency.I have also included a teacher key to show you what to fill in the blanks as your students follow along.To use these notes, I simply projected them onto my whiteboard, gave the students their blank copies, and had them follow along and write what I wrote. This works great when
Subjects:
Grades:
5th - 12th
CCSS:
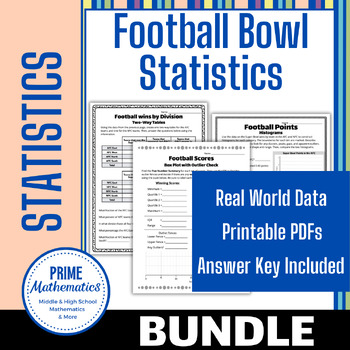
Football Bowl Statistics Super Bundle
Use statistics from previous football championships to practice finding measures of central tendency and variability and creating charts such as box-and-whisker plots, dot plots, and histograms. The students will look at football championship wins and scores. This is a super way to engage sports fans in math.The following topics are covered:Mean, Median, & ModeFive-number summaryIQR & RangeBox plots (with or without checking for outliers)Mean absolute deviationStandard deviationHistogram
Subjects:
Grades:
6th - 12th
Types:
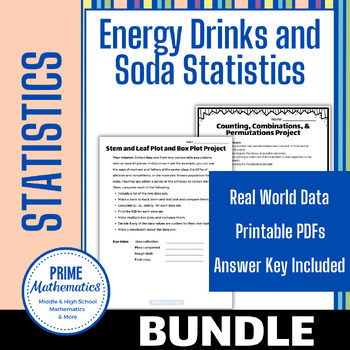
Energy Drinks and Sodas Statistics Bundle
Use statistics about energy drinks and sodas (sugar and caffeine content) to practice finding measures of central tendency and variability and creating charts such as box-and-whisker plots, dot plots, and histograms. The students will compare the amount of sugar and caffeine in energy drinks and sodas.The following topics are covered:Mean, Median, & ModeFive-number summaryIQR & RangeBox plots (with or without checking for outliers)Mean absolute deviationStandard deviationHistogramDot Plo
Subjects:
Grades:
6th - 12th
Types:
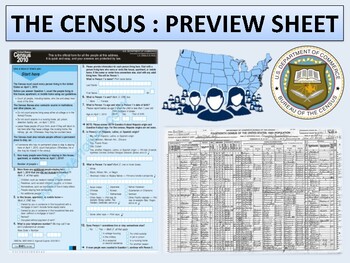
The Census - Cross-Curricular Mini Unit
With the 2020 census coming up, this mini unit is the perfect addition to any Social Studies or Math class. Included are four main lessons covering the history and functions of the census with a variety of geographic and statistical activities culminating in a final mock-census project. Please download the preview sheet for more details.Lesson one of the unit is available as a free download here.Included in the product file are reading and work sheets, answer keys, lesson plans, and a PowerPoi
Grades:
7th - 12th
Types:
CCSS:
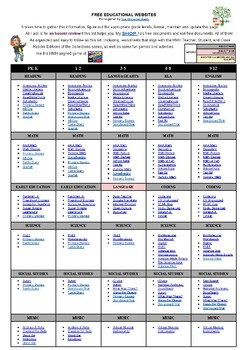
FREE EDUCATIONAL WEBSITES LIST 4 ALL GRADES K-12 AND SUBJECTS + TEACHER RESOURCE
Sometimes, you just need a list of websites for everyone. Here it is. FREE EDUCATIONAL WEBSITES Put together by Teach Me, Maria!It takes time to gather this information, figure out the appropriate grade levels, and format, maintain, and update this page. All I ask is for an honest review if this list helps you.
Subjects:
Grades:
PreK - 12th, Staff
Types:
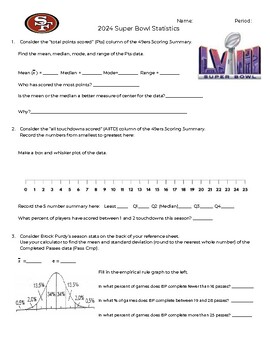
2024 Super Bowl Statistics Activity
This activity contains two stats sheets - one for the San Francisco 49ers and one for the Kansas City Chiefs. Students are asked to use the data from the various tables to answer questions about the teams. This activity covers 1 variable statistics (mean, median, mode, range, standard deviation, box-and-whisker plot, histogram, two-way tables).This would be great as a partner activity or class activity.
Subjects:
Grades:
6th - 12th
Types:
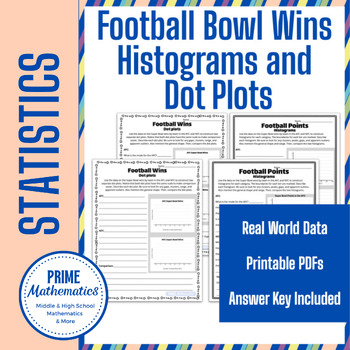
Histograms and Dot Plots of Football Bowl Wins and Points
Use statistics about the number of football bowl wins or points per team to practice finding measures of central tendency and variability and creating dot plots and histograms. The students will compare the distribution of the number of national pro football championship wins or points between the American conference and the National conference. This is a super way to engage sports fans in math.The following topics are covered:Histogram (points)Dot Plots (wins)It includes a higher-level (shape,
Subjects:
Grades:
6th - 12th
Types:
CCSS:
Also included in: Football Bowl Statistics Super Bundle
Google Forms™ Quiz - Comparing Data Distributions - 7.SP.3 7.SP.4
About This Resource:This is a Google Forms Quiz on questions involving the comparison of data distributions from one population to another. The instructions are easy to follow for you to make a copy of the quiz to your Google Drive. Then you can assign to your students using Google Classroom or some other method. Please see the preview for screenshots of the exact questions on the assessment. Questions on this assessment were carefully created to give our students the best practice on the follow
Subjects:
Grades:
7th - 12th
Types:
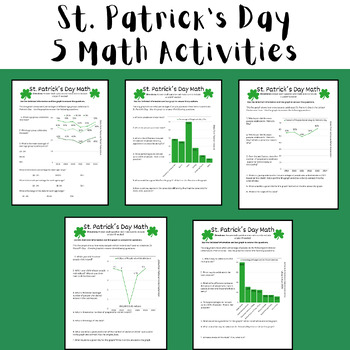
St. Patrick's Day Math Activities (Test Prep Data Analysis) Printable or Digital
These 5 activities are fun NO PREP math activities to do to celebrate St. Patrick's Day. The activities can be completed as 5 separate pages or as a 5 page packet. There is a customizable digital resource (Canva Template) and a printable resource (Canva) that contain the same directions and activity. This was designed for students in middle school, but could be used for upper elementary and high school students in Pre Algebra, Pre-Algebra, or Algebra.In this assignment, students are asked to:Gra
Subjects:
Grades:
3rd - 12th, Staff
Types:
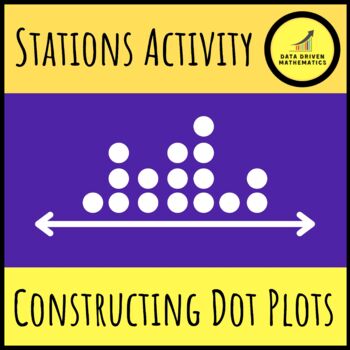
Constructing Dot Plots - Stations Activity
About This Resource:In this activity students will practice constructing dot plots when provided a data set. Student will then use the dot plot to determine the mean, median, mode, and range and then determine the spread of the data.The prep required by the teacher consists of printing the stations cards, making a copy of the graphic organizer for each student, and setting the expectations and instructions with their students.Your students will love this activity and the process will allow you t
Subjects:
Grades:
6th - 12th
Types:
CCSS:

6 Editable Bar Graph Templates 2.0
Finally a simple and professional graph space that students can fill out without any design issues getting in the way. This file contains 6 ready-to-use graph options. Print them and have students fill them with pencil and ruler, or distribute them over computer and let them practice entering the data. Get a project perfect finish every time. Maybe you just want to fill it out live on a projector? The possibilities are endless! It's okay to say you love these bar graphs. So do we.Contains:- 2 bl
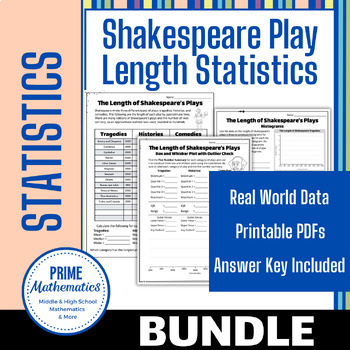
Shakespeare Play Length Statistics Bundle
Use the length of Shakespeare’s plays (in lines, rounded to the nearest thousand) to practice finding measures of central tendency and variability and creating charts such as box-and-whisker plots, dot plots, and histograms. The students will compare the length of Shakespeare’s tragedies to his comedies and his histories.The following topics are covered:Mean, Median, & ModeFive-number summaryIQR & RangeBox plots (with or without checking for outliers)Mean absolute deviationStandard devia
Subjects:
Grades:
6th - 12th
Types:
CCSS:
Intro to Statistics Unit Lessons
Complete lessons for everything your students need to know to get started studying stats.
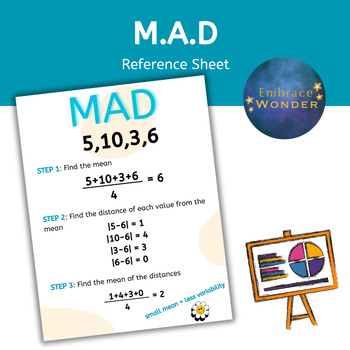
M.A.D Reference Sheet | Mean Absolute Deviation Graphic Organizer | Statistics
Teaching M.A.D? Is your classroom filled with the joy of students analyzing data and crunching numbers? Add this Mean Absolute Deviation Reference Sheet to your lesson collection. Also great for students in an IEP that require a graphic organizer in their lessons. Easy to print and project!What's included:1 PDF• Images are high resolution PDFs, perfect for printing and web use.---------------------------------------------------------------------------------------------------------------Let's Con
Subjects:
Grades:
5th - 12th, Higher Education, Adult Education, Staff
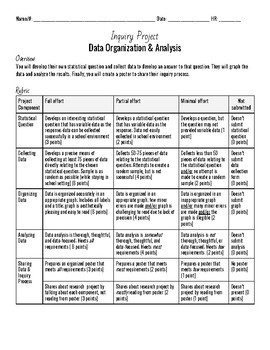
Inquiry Project: Data Organization & Analysis
This assignment can be used in many ways to allow students to engage in the inquiry process while practicing valuable statistics skills.
Promotes Curiosity & Critical Thinking:
In today’s digital world, curiosity is a lost art form; if we have a question, we simply ask Google. There’s no need to think deeply or wonder about the world, because many answers are already online! This project helps students practice the curiosity that is critical for the inquiry process by engaging them in ques
Subjects:
Grades:
4th - 12th
Types:
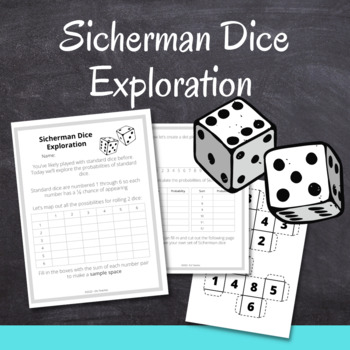
Probability Exploration - Sicherman Dice - Self-Guided with Differentiation
This resource is a self-guided probability exploration activity. Perfect for a sub to hand out, for an independent activity after a test, or as a print-and-go worksheet. It includes three levels of differentiation for students of all abilities, in order to make fun math concepts as accessible as possible.Printable dice templates are included for students to create their own physical versions of Sicherman dice.
Subjects:
Grades:
6th - 12th
CCSS:
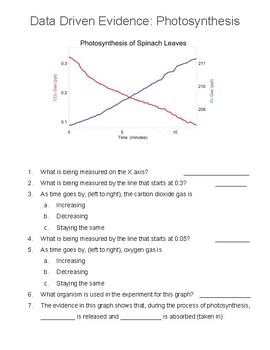
Data Driven Lesson: Evidence of Photosynthesis
Use graph data to understand the roles of carbon dioxide, oxygen, and light in photosynthesis (2 sided)

All of the Common Core Math Standards Checklists
This is a bundle of checklists for Math Common Core Standards for all of the grades (K-12) on an excel spreadsheet with 5 columns for data input. These standards are organized in their own sub-domains to coordinate lessons. Please see my free file for an example.
Subjects:
Grades:
K - 12th
Types:
Intro to Statistics Lesson #1 - Statistical Questions (Editable)
Lesson one to intro to statistics unit. Answering the question to what is statistics, how do we ask a statistical question, and what is the difference between numerical and statistical data. Complete with warm-up, practice, and the opportunity to complete a project to apply our learning!
Subjects:
Grades:
6th - 12th
Types:
Also included in: Intro to Statistics Unit Lessons
Math Notebook
My students call this their "Math Bible". It has a one page of notes for each lesson of Pre-Algebra.Skills in here are used in 5th-12th grade. & definitely beneficial for homeschool use. I have students either glue them into their own notebook or I will hole punch and have them put into a folder/binder.Other teachers have asked for this notebook to refresh their memory.
Subjects:
Grades:
5th - 12th, Higher Education, Adult Education, Staff
Showing 1-24 of 38 results

